Gold Price Forecast: XAU/USD’s fate hinges on US CPI after key 21-day SMA gives way
- Gold price defends $2,600, at its lowest level in three weeks as US CPI data loom.
- The US Dollar sees a modest pullback, as China stimulus optimism lifts the market mood.
- Gold price cracks 21-day SMA at $2,622 but bullish daily RSI still keeps buyers alive.

Gold price is nursing losses above $2,600 early Thursday after falling for the sixth straight day on Wednesday. The bright metal sits at its lowest level in three weeks in the run-up to the all-important US Consumer Price Index (CPI) data release due later this Thursday.
All eyes remain on the US CPI inflation data
According to the CME Group's FedWatch Tool, markets continue to price in an 82% chance that the US Federal Reserve (Fed) will opt for a 25 basis point (bps) interest rate cut in November. The market’s expectations for the next Fed policy move did not change even though the Minutes of the Fed’s September meeting were read dovishly.
The Minutes showed on Wednesday that a substantial majority of officials supported an outsized 50 bps rate cut to balance confidence in inflation with worries over the labor market.
Therefore, the US consumer inflation data for September holds the key to completely ruling out a jumbo Fed rate cut probability, advocated by a surprisingly strong US Nonfarm Payrolls report, which suggested that the labor market is in a healthy condition than initially feared.
The annual CPI is seen rising 2.3% in September after increasing by 2.5% in August. The core CPI is set to hold steady at 3.2% YoY in the same period. On a monthly basis, the US CPI inflation is expected to tick a tad lower to 0.1% in September vs. August’s 0.2%. The core figure is also likely to ease to 0.2%, following a 0.3% growth in August.
A bigger-than-expected decline in both the annual and monthly CPI inflation data could revive hopes for an outsized Fed rate cut next month, triggering a fresh correction in the US Dollar (USD) against its major rivals. Gold price could stage a strong comeback on aggressive Fed’s easing expectations and the potential USD’s demise.
On the other hand, markets could even dial down bets of a 25 bps rate cut in November, if the US CPI data surprises to the upside across the time horizon. In such a scenario, the non-interest-bearing Gold price could be hit the most while the Greenback is expected to see an extended recovery.
Anticipating the main event risk of this week, the US CPI data, traders seem non-committal and refrain from placing fresh bets on the bright metal. Gold price, however, draws some support from the latest news surrounding Chinese stimulus.
On Wednesday, China’s Finance Ministry announced that it will roll out a fiscal stimulus package worth CNY 2 trillion on Saturday to support economic growth. Meanwhile, the People's Bank of China (PBOC) launched a security, funds and insurance companies swap facility) for CNY500 billion to boost domestic stock markets on Thursday.
Gold price technical analysis: Daily chart
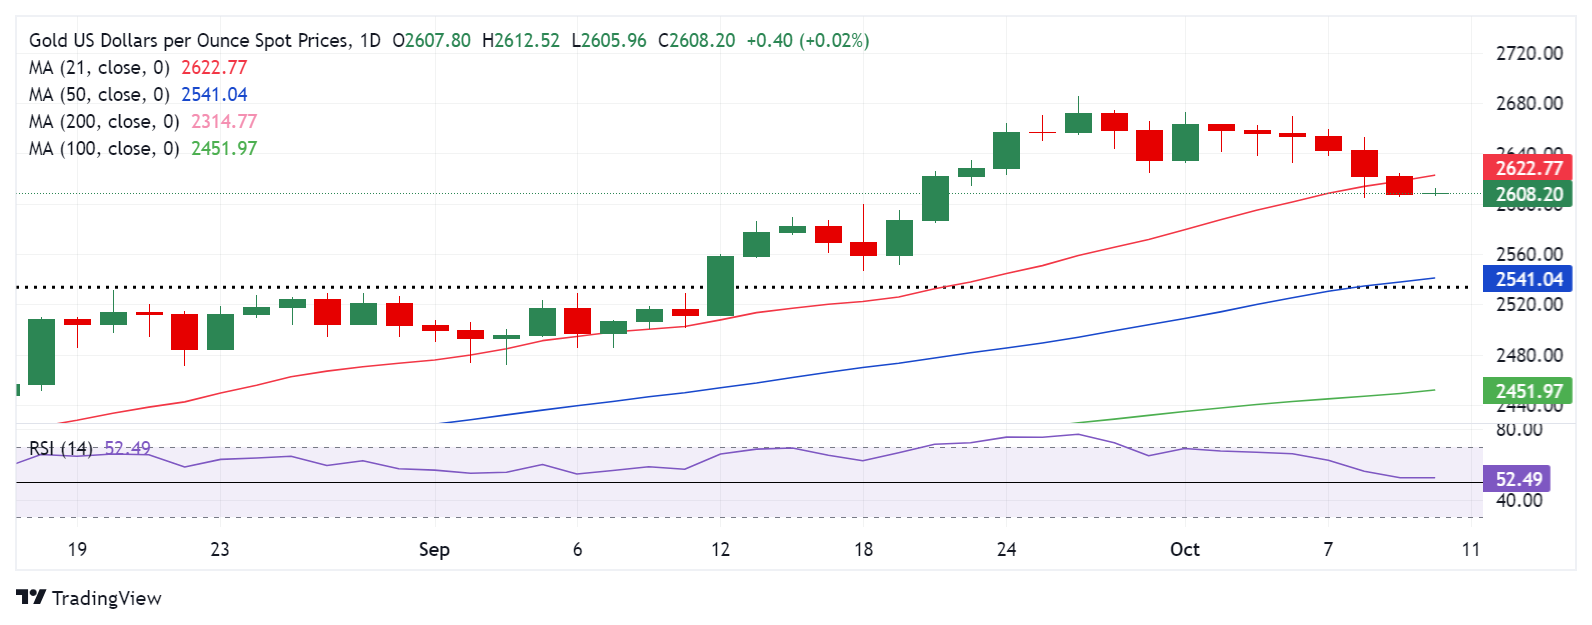
Buyers continue to defend their positions even after Gold price closed Wednesday below the key 21-day Simple Moving Average (SMA) support, then at $2,619.
With the 14-day Relative Strength Index (RSI) still holding above the 50 level, Gold buyers remain hopeful about a potential turnaround.
On the downside, the immediate support is seen at the $2,600 threshold. A sustained break below the latter could extend the downside toward the September 20 low of $2,585.
Alternatively, Gold price needs to recapture the 21-day SMA support-turned-resistance, now at $2,623, to revive the uptrend.
The next bullish targets are seen at the $2,650 psychological barrier and the intermittent highs near $2,670.
Economic Indicator
Consumer Price Index (YoY)
Inflationary or deflationary tendencies are measured by periodically summing the prices of a basket of representative goods and services and presenting the data as The Consumer Price Index (CPI). CPI data is compiled on a monthly basis and released by the US Department of Labor Statistics. The YoY reading compares the prices of goods in the reference month to the same month a year earlier.The CPI is a key indicator to measure inflation and changes in purchasing trends. Generally speaking, a high reading is seen as bullish for the US Dollar (USD), while a low reading is seen as bearish.
Read more.Next release: Thu Oct 10, 2024 12:30
Frequency: Monthly
Consensus: 2.3%
Previous: 2.5%
Source: US Bureau of Labor Statistics
The US Federal Reserve has a dual mandate of maintaining price stability and maximum employment. According to such mandate, inflation should be at around 2% YoY and has become the weakest pillar of the central bank’s directive ever since the world suffered a pandemic, which extends to these days. Price pressures keep rising amid supply-chain issues and bottlenecks, with the Consumer Price Index (CPI) hanging at multi-decade highs. The Fed has already taken measures to tame inflation and is expected to maintain an aggressive stance in the foreseeable future.
Premium
You have reached your limit of 3 free articles for this month.
Start your subscription and get access to all our original articles.
Author

Dhwani Mehta
FXStreet
Residing in Mumbai (India), Dhwani is a Senior Analyst and Manager of the Asian session at FXStreet. She has over 10 years of experience in analyzing and covering the global financial markets, with specialization in Forex and commodities markets.


