Gold Price Forecast: XAU/USD’s bullish potential appears limited amid bear cross, firmer yields
- Gold price holds above critical 21-DMA but acceptance above 50-DMA is critical
- Bullish potential appears limited in gold amid a bear cross on the daily sticks.
- The dynamics in yield, USD to drive the gold price action amid a scarce docket.

Gold price snapped a two-day downtrend on Tuesday and rallied as high as $1785 before reversing sharply to finish the day with moderate gains at $1769. In doing so, gold price recovered Monday’s losses while defending the critical short-term 21-Daily Moving Average (DMA) at $1761.
The two-way businesses in gold price were mainly driven by the dynamics in the US Treasury yields and the dollar, as the risk-on sentiment led the way. In the first half of the day, gold price gained nearly $20 after the US dollar was sold-off into the market optimism, as investors remained expectant of stronger American corporate earnings reports. Fears over the hawkish Fed’s expectations and stagflation worries took a backseat, as the US Treasury yields continued its march northwards. The persistent strength in the US rates rescued the dollar bulls, triggering a fresh pullback in gold price from higher levels. The rebound in Wall Street indices also weighed negatively on the safe-haven gold. Increasing expectations of the Bank of England (BOE) kicking off its rate-hike cycle in November also dented the sentiment around the bright metal.
Amid a scarce US economic docket this Wednesday, gold price is building onto the previous gains, as the safe-haven greenback remains on the defensive amid cautious optimism. Investors remain wary ahead of the UK inflation data while the corporate earnings and hopes that the Chinese regulatory crackdown has passed keep the sentiment somewhat buoyed. Easing worries over the troubled China Evergrande Group also add to the upbeat mood. Meanwhile, the retreat in the benchmark 10-year Treasury yields from five-month highs of 1.672% aids the upside in gold price.
However, it remains to be seen if the yellow metal manages to extend the recent gains, as the rally in the global yields will likely continue amid hawkish expectations from the key central banks, including the Fed and the BOE.
Gold Price Chart - Technical outlook
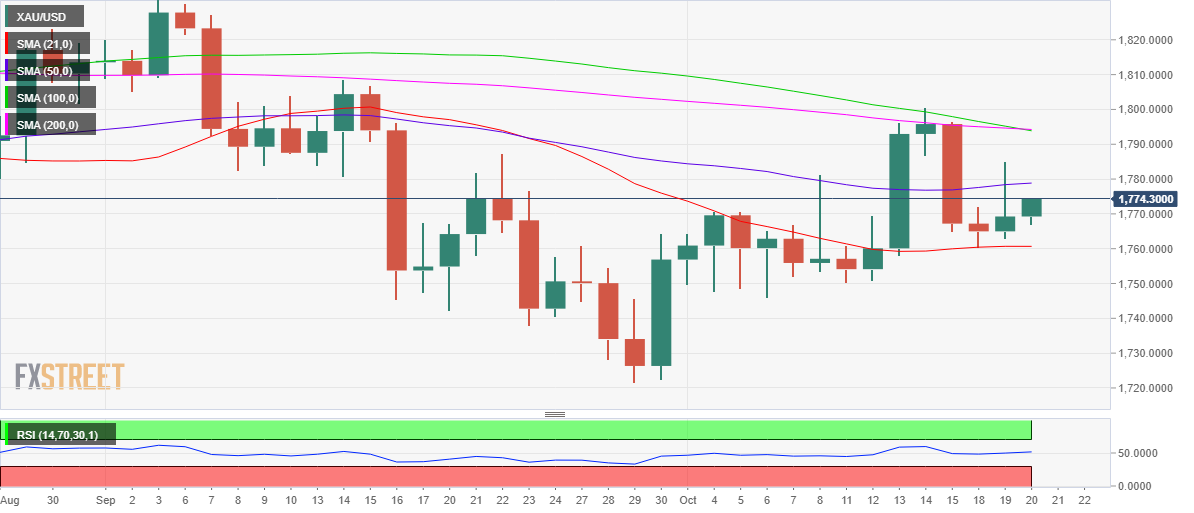
Gold: Daily chart
So long as gold price defends the horizontal 21-Daily Moving Average (DMA) at $1761, the risks appear skewed to the upside.
The 14-day Relative Strength Index (RSI) is trading flattish above the midline, backing the renewed upside.
However, the bear cross confirmed on the daily sticks on Tuesday warrants caution for gold bulls. The 100-DMA cut the 200-DMA from above flagging a bearish signal.
On the upside, gold price is likely to face resistance once again at the horizontal 50-DMA at $1779. A sustained move above the latter could call for a retest of the 100 and 200-DMAs confluence zone at $1794. A sustained break above the latter could expose the $1800 round number.
Only a daily closing below the 21-DMA support will negate the recent upbeat tone. If the latter yields in, then the previous week’s support area around $1750-$1745 would be challenged. The multi-week lows of $1722 could be tested should the downside momentum pick up pace.
Premium
You have reached your limit of 3 free articles for this month.
Start your subscription and get access to all our original articles.
Author

Dhwani Mehta
FXStreet
Residing in Mumbai (India), Dhwani is a Senior Analyst and Manager of the Asian session at FXStreet. She has over 10 years of experience in analyzing and covering the global financial markets, with specialization in Forex and commodities markets.