Gold Price Forecast: XAU/USD trades near its weekly peak in the $1,930 region

XAU/USD Current price: $1,925.95
- The Reserve Bank of Australia paused and kept the Official Cash Rate at 4.1%.
- Market players await news on the United States employment sector.
- XAU/USD posted a modest advance on Tuesday, but the long-term picture still indicates the absence of buyers.
Spot Gold trades near its weekly high set on Monday at $1,930.98, posting gains for a fourth consecutive day. Without relevant news and with the United States makers closed amid the country celebrates Independence Day, financial assets remain lifeless and confined to familiar levels.
Overnight, the Reserve Bank of Australia (RBA) announced it kept the Official Cash Rate (OCR) unchanged at 4.1%, with policymakers saying inflation in the economy has “passed its peak.” Aussie’s decline provided near-term support to the US Dollar, but the American currency quickly changed course, edging lower against most major rivals, as Asian shares managed to maintain the green. Their European counterparts, however, finished the day in the red.
Other than that, the macroeconomic calendar had little to offer, with market players waiting for the United States (US) labor market updates with different reports scheduled for the second half of the week.
XAU/USD price short-term technical outlook
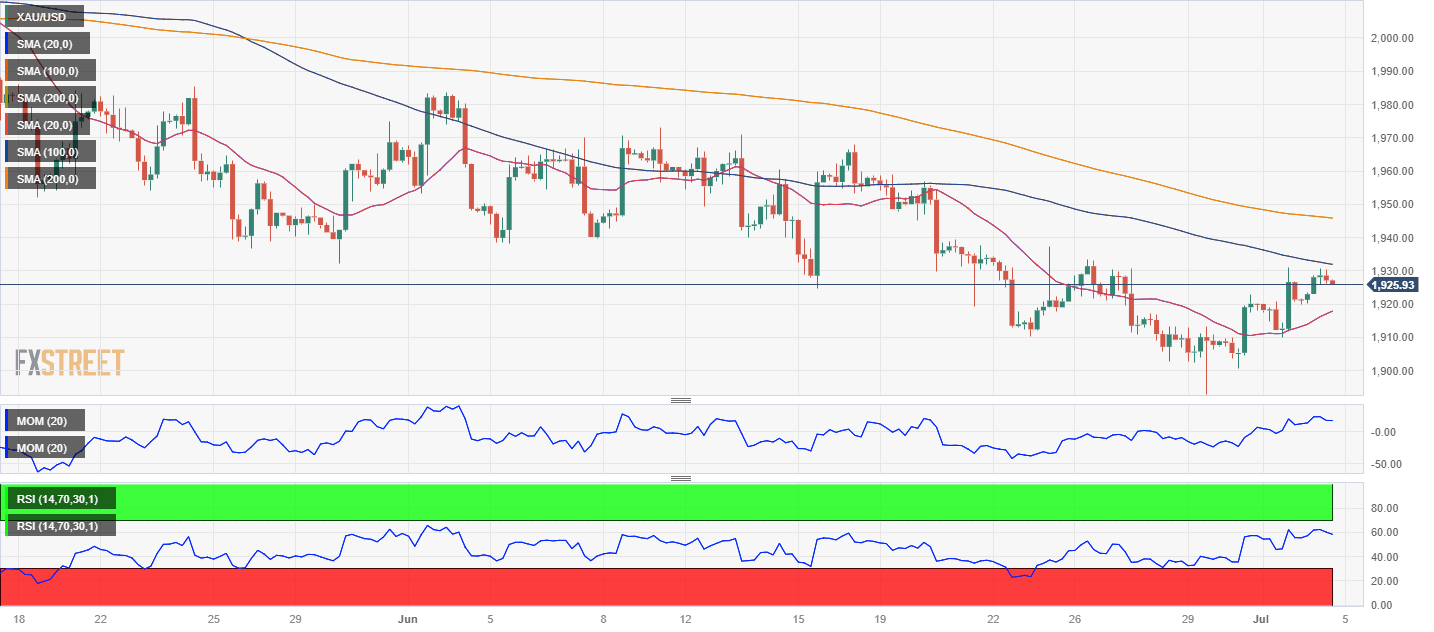
XAU/USD currently hovers around $1926 a troy ounce, with its bullish potential still limited, according to technical readings in the daily chart. Gold remains below a bearish 20 Simple Moving Average (SMA), which heads south below the 100 SMA. At the same time, technical indicators have stalled their recovery, turning directionless just below their midlines.
In the near term, and according to the 4-hour chart, XAU/USD still has room to recover its bullish poise. The bright metal develops above a bullish 20 SMA, while the longer ones keep heading lower above the current level. The 100 SMA currently provides dynamic resistance at around $1,932.75. Finally, technical indicators remain near their recent highs within positive levels, although the Relative Strength Index (RSI) turned marginally south, in line with the retracement from the intraday high.
Support levels: 1,917.30 1,903.00 1,892.95
Resistance levels: 1,932.75 1,945.20 1,958.30
Premium
You have reached your limit of 3 free articles for this month.
Start your subscription and get access to all our original articles.
Author

Valeria Bednarik
FXStreet
Valeria Bednarik was born and lives in Buenos Aires, Argentina. Her passion for math and numbers pushed her into studying economics in her younger years.


