Gold Price Forecast: XAU/USD traders appear non-committal on the US election day
- Gold price mires in multi-day troughs near $2730 as Americans head to polls.
- The US Dollar licks its wounds after the Trump trades unwinding on Monday.
- Gold traders stay unnerved below the 23.6% Fibo level, despite bullish technicals.

Gold price is miring in five-day lows near $2,730 in Asian trading on Tuesday, lacking a clear direction. Traders remain wary and refrain from placing fresh bets on Gold price on the US presidential election day.
All eyes on US presidential election, exit polls
Gold price has entered a phase of downside consolidation, following its slump from all-time highs of $2,790 reached last Thursday, in the face of resurgent US Dollar (USD) demand. The Greenback jumped back into the bid, capitalizing on the Trump trade optimism.
Until last week, markets were pricing in a Republican nominee Donald Trump victory in the presidential race. They believed Trump's policies on immigration, tax cuts and tariffs would put upward pressure on inflation, bond yields and the USD while a policy continuity is seen on a Harrish win.
However, the tide turned against the USD on Monday as traders resorted to the unwinding of the Trump trade, as the latest polls released over the weekend showed that US Democratic presidential candidate Kamala Harris surpassed Donald Trump in a new poll in Iowa, marking a notable turnaround.
Harris and Trump are seen locked in a tight race for the White House.
Early Tuesday, the latest developments around the US election show that former president Donald Trump is leading Vice President Harris in each of the seven swing states though the margin is narrow. The AtlasIntel survey said Trump is holding the widest margin in Arizona, with a 52.3% to Harris' 45.8%.
This update seems to have helped the Greenback pause its downside, keeping the USD-denominated Gold price on the edge. Further, expectations of a less aggressive easing cycle by the US Federal Reserve (Fed) also lend support to the USD.
Besides, the uncertainty surrounding the US election outcome, markets also take account of the ongoing Middle East conflict between Israel and Iran.
The Israeli military said that it had killed a commander of Hezbollah's Nasser Brigade rocket unit in southern Lebanon. In response, Hezbollah announced it launched a “large rocket salvo” targeting the northern Israeli city of Safed, marking an escalation in cross-border tensions.
If the geopolitical tensions escalate further, investors are likely to scurry to the traditional safe-haven Gold price, cushioning its downside.
However, the sentiment around the US election is expected to play a pivotal role in the Gold price action in the upcoming days.
Gold price technical analysis: Daily chart
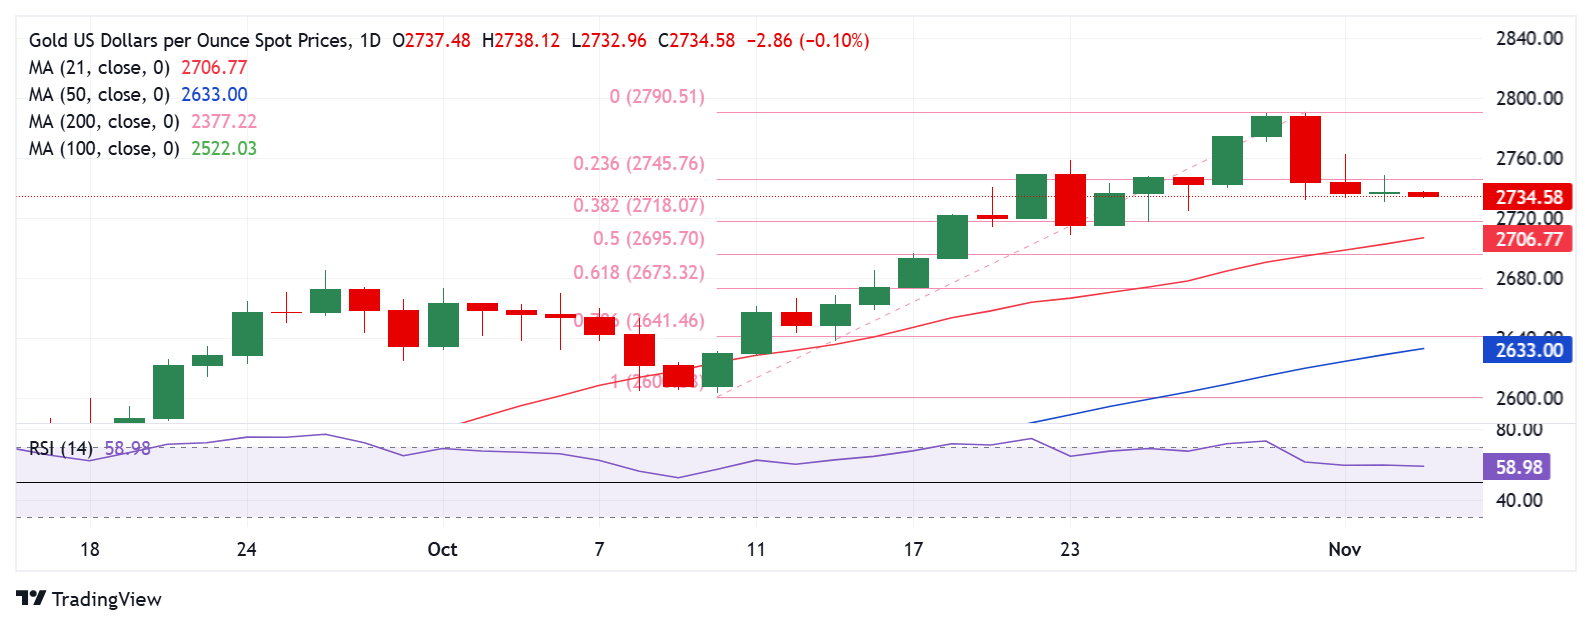
As observed on the daily chart, Gold price challenges the key $2,730 demand area as sellers retain control.
The 14-day Relative Strength Index (RSI) is edging slightly lower to near 59, justifying the latest downtick in Gold price.
However, the leading indicator continues to hold above the 50 level, keeping the buying interest somewhat alive.
Gold buyers need to reclaim the $2,746 resistance on a daily closing basis to resume its uptrend. That level is the 23.6% Fibonacci Retracement (Fibo) level of the latest record rally from the October 10 low of $2,604 to the new all-time high of $2,790.
The next bullish target is seen at the record high of $2,790.
Conversely, a sustained move below $2,730 will expose the 38.2% Fibo support at $2,718.
Acceptance below that level on a daily candlestick closing basis could challenge the $2,700 confluence zone, where the 50% Fibo level of the same ascent and the 21-day Simple Moving Average (SMA) close in.
Additional declines will call for a test of the 61.8% Fibo support at $2,673.
Gold FAQs
Gold has played a key role in human’s history as it has been widely used as a store of value and medium of exchange. Currently, apart from its shine and usage for jewelry, the precious metal is widely seen as a safe-haven asset, meaning that it is considered a good investment during turbulent times. Gold is also widely seen as a hedge against inflation and against depreciating currencies as it doesn’t rely on any specific issuer or government.
Central banks are the biggest Gold holders. In their aim to support their currencies in turbulent times, central banks tend to diversify their reserves and buy Gold to improve the perceived strength of the economy and the currency. High Gold reserves can be a source of trust for a country’s solvency. Central banks added 1,136 tonnes of Gold worth around $70 billion to their reserves in 2022, according to data from the World Gold Council. This is the highest yearly purchase since records began. Central banks from emerging economies such as China, India and Turkey are quickly increasing their Gold reserves.
Gold has an inverse correlation with the US Dollar and US Treasuries, which are both major reserve and safe-haven assets. When the Dollar depreciates, Gold tends to rise, enabling investors and central banks to diversify their assets in turbulent times. Gold is also inversely correlated with risk assets. A rally in the stock market tends to weaken Gold price, while sell-offs in riskier markets tend to favor the precious metal.
The price can move due to a wide range of factors. Geopolitical instability or fears of a deep recession can quickly make Gold price escalate due to its safe-haven status. As a yield-less asset, Gold tends to rise with lower interest rates, while higher cost of money usually weighs down on the yellow metal. Still, most moves depend on how the US Dollar (USD) behaves as the asset is priced in dollars (XAU/USD). A strong Dollar tends to keep the price of Gold controlled, whereas a weaker Dollar is likely to push Gold prices up.
Premium
You have reached your limit of 3 free articles for this month.
Start your subscription and get access to all our original articles.
Author

Dhwani Mehta
FXStreet
Residing in Mumbai (India), Dhwani is a Senior Analyst and Manager of the Asian session at FXStreet. She has over 10 years of experience in analyzing and covering the global financial markets, with specialization in Forex and commodities markets.


