Gold Price Forecast: XAU/USD set to test $1850 amid bullish technical setup, US PCE eyed
- Gold price consolidates the upside before the next push higher.
- Covid-led risk-off offers support to the US dollar while yields sag.
- Gold price defends 200-DMA ahead of the US PCE inflation.

Gold price rallied nearly $23 on Thursday to reach the highest levels since July 15 at $1732, as the bulls got a fresh boost after piercing through the 200-Daily Moving Average (DMA) at $1821. Gold price settled the day at $1828, well above the 200-DMA.
The dovish Fed-induced uptrend in gold price gathered steam after the US Q2 Preliminary Gross Domestic Product (GDP) missed estimates with 6.5%. Downbeat US growth numbers added further to the signs that the Fed could stay away from tapering announcement any time soon. The US dollar hit fresh monthly lows amid dovish Fed and disappointing data while ignored the rebound in the Treasury yields, courtesy of the upbeat market mood and US infrastructure stimulus optimism. The US Senate remained upbeat on prospects for a $1 trillion bipartisan infrastructure bill backed by President Joe Biden, offering support to the stocks as well as gold. Meanwhile, underlying covid concerns also collaborated with the upside in the traditional safe-haven gold.
On the final trading day of an eventful week, gold price is easing from multi-day highs but holds a major part of Thursday’s advance. The pullback in gold price could be attributed to the rebound in the US dollar across the board, as escalating coronavirus concerns across the globe lifted the safe-haven demand for the greenback. The Asian market is a sea of red, with Japan set to extend the state of emergency in other prefectures beyond Tokyo. The US CDC reimposed the mask mandate amid a spike in Delta variant infection. However, the bulls continue to draw support from upbeat US infrastructure news and expectations of a boost in India’s gold demand amid the upcoming festive season.
Next of relevance for gold traders remain the Fed’s most preferred inflation gauge, the Core PCE Price Index. However, the inflation data may have little impact on the markets, as Fed Chair Jerome Powell dismissed higher inflation while the taper timing announcement is likely to be delayed after July’s dovish policy statement.
Gold Price Chart - Technical outlook
Gold: Four-hour chart
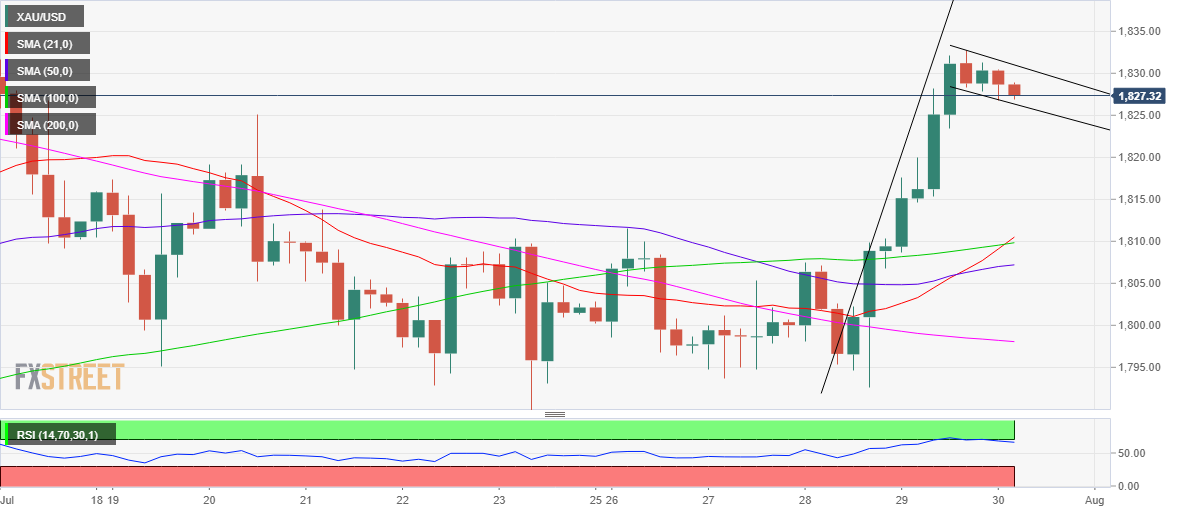
Gold price has carved out a potential bull flag formation on the four-hour chart, considering the ongoing consolidation that followed Thursday’s upsurge.
The bulls need a four-hour candlestick closing above the falling trendline resistance at $1831.
The upside breakout would open doors for a test of the $1850 psychological level. Ahead of that the July 15 high of $1834 could challenge the bullish commitments.
The Relative Strength Index (RSI) has eased out from the overbought region to now trade at 66.95, suggesting that the next upswing could be in the offing.
The 21-Simple Moving Average (SMA) and 100-DMA bullish crossover also adds credence to the additional upside.
On the flip side, if the pullback extends below the falling trendline support at $1826 on a sustained basis, then a drop towards the 21 and 100-SMAs confluence at $1809 cannot be ruled out.
Premium
You have reached your limit of 3 free articles for this month.
Start your subscription and get access to all our original articles.
Author

Dhwani Mehta
FXStreet
Residing in Mumbai (India), Dhwani is a Senior Analyst and Manager of the Asian session at FXStreet. She has over 10 years of experience in analyzing and covering the global financial markets, with specialization in Forex and commodities markets.


