Gold Price Forecast: XAU/USD sees a dead cat bounce, downside favored whilst below 200 DMA
- Gold price licks its wounds after the downside break of 200 DMA.
- China’s economic woes, hawkish Fed Minutes boost the US Dollar and the US Treasury bond yields.
- The daily technical setup favors Gold sellers ahead of the mid-tier US data.

Gold price is consolidating lossess in early Thursday’s trading, having touched the lowest level in five months at $1,890. Gold sellers are biding time before the next push lower, as the United States Dollar (USD) continues to garner demand heading into a fresh batch of mid-tier US economic data.
US Dollar keeps rallying, Gold price at the losing end
Gold price is coming up for some air after the relentless three-day decline, fuelled by a broadly firmer US Dollar amid an increased flight to safety and economic resilience showcased by the recent US economic statistics.
The Greenback built onto its upsurge on Wednesday after the benchmark 10-year US Treasury bond yields climbed to fresh 10-month highs just above 4.30% on the hawkish US Federal Reserve Minutes of the July meeting. The Fed Minutes revealed that "most" policymakers continued to pledge to tame inflation while seeing ‘upside risks’ to inflation, possibly suggesting more rate hikes to come from the Federal Reserve.
Additionally, lingering Chinese economic concerns combined with the revival of the hawkish Fed expectations sent risk tumbling, infusing safe-haven flows into the US Dollar. Upbeat US housing data also added to the positive mood around the US Dollar, exacerbating the pain in the non-interest-bearing Gold price. Single-family homebuilding in the United States rose 6.7% while Building Permits ticked up 0.1% to an annualized pace of 1.44 million units.
Later in the day, the US weekly Jobless Claims and Philadelphia Fed Manufacturing Survey will be eyed to confirm a resilient US economy, which could trigger a fresh leg higher in the US Dollar. The Greenback is likely to remain in a win-win situation even if risk sentiment takes a further knock.
Gold price technical analysis: Daily chart
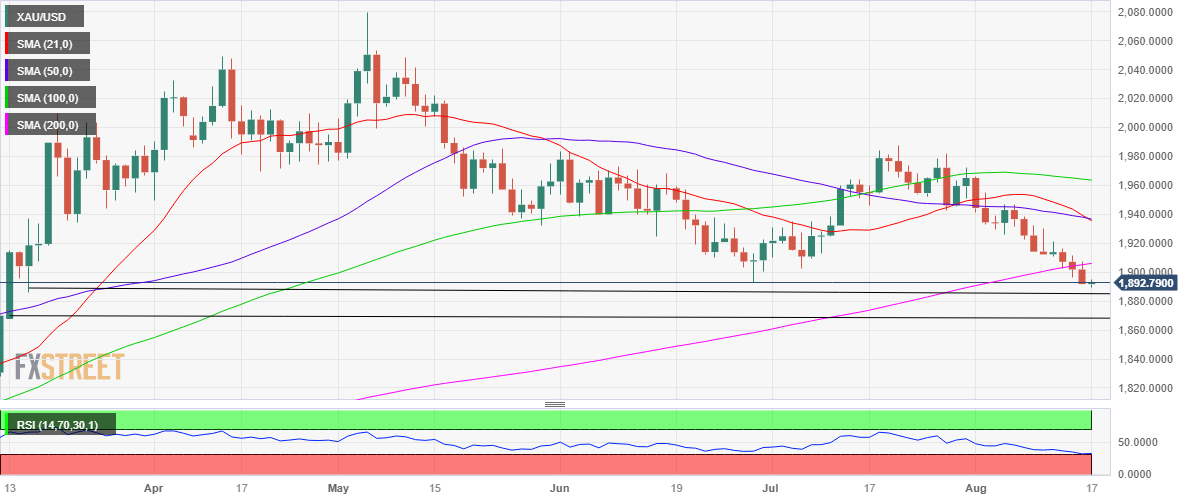
Gold price extended its downside break of the all-important 200-Daily Moving Average (DMA), now at $1,906, on Wednesday, aided by a Bear Cross confirmation on the daily chart.
The downward-sloping 21 DMA cut the 50 DMA from above on a daily closing basis, validating the bearish continuation pattern. The 14-day Relative Strength Index (RSI) is sitting just above the oversold territory, suggesting that there is more room for Gold sellers to flex their muscles.
Amidst bearish technical indicators, the downside bias remains intact for Gold price despite the renewed uptick. The immediate support is seen at the five-month low of $1,890, below which the March 15 low of $1,886. Deeper declines will test areas under the $1,870 static support.
On the flip side, Gold price needs to recapture the 200 DMA support-turned-resistance to initiate a decent comeback toward the key hurdle at the $1,920 round figure. The next relevant resistance is envisioned at the $1,930 supply zone.
Premium
You have reached your limit of 3 free articles for this month.
Start your subscription and get access to all our original articles.
Author

Dhwani Mehta
FXStreet
Residing in Mumbai (India), Dhwani is a Senior Analyst and Manager of the Asian session at FXStreet. She has over 10 years of experience in analyzing and covering the global financial markets, with specialization in Forex and commodities markets.


