XAU/USD Current price: $2,443.88
- The United States Consumer Price Index resulted marginally softer in July.
- Market participants keep beating the Federal Reserve will trim rates in September.
- XAU/USD could extend its slide once clearly below $2,438.80, a Fibonacci support level.
The US Dollar started the day on the back foot, shedding ground against most major rivals as optimistic investors lift bets for an upcoming Federal Reserve (Fed) rate cut on Tuesday. The United States (US) published softer-than-anticipated inflation-related figures before finally revealing the July Consumer Price Index (CPI) on Wednesday.
According to the Bureau of Labor Statistics (BLS), the CPI rose by 2.9% on a yearly basis in July, easing from the 3% posted in June. The annual core CPI, which excludes volatile food and energy prices, rose 3.2%, below the 3.3% previous, although matching expectations. Finally, inflation rose 0.2% on a monthly basis, as expected. The figures initially sent the USD further down, although not enough to trigger relevant breakouts.
As per XAU/USD, the pair peaked at $2,479.80 with the news but turned south afterwards as demand for high-yielding assets weighed on the bright metal. The pair finally collapsed after Wall Street’s opening, as the Dow Jones Industrial Average (DJIA) and the S&P500 ran to fresh weekly highs.
For the most, US CPI figures confirmed what the market hopes: that the Federal Reserve (Fed) will trim interest rates in its September meeting, not only because of inflation easing but also because of the risk high rates pose to economic growth.
XAU/USD short-term technical outlook
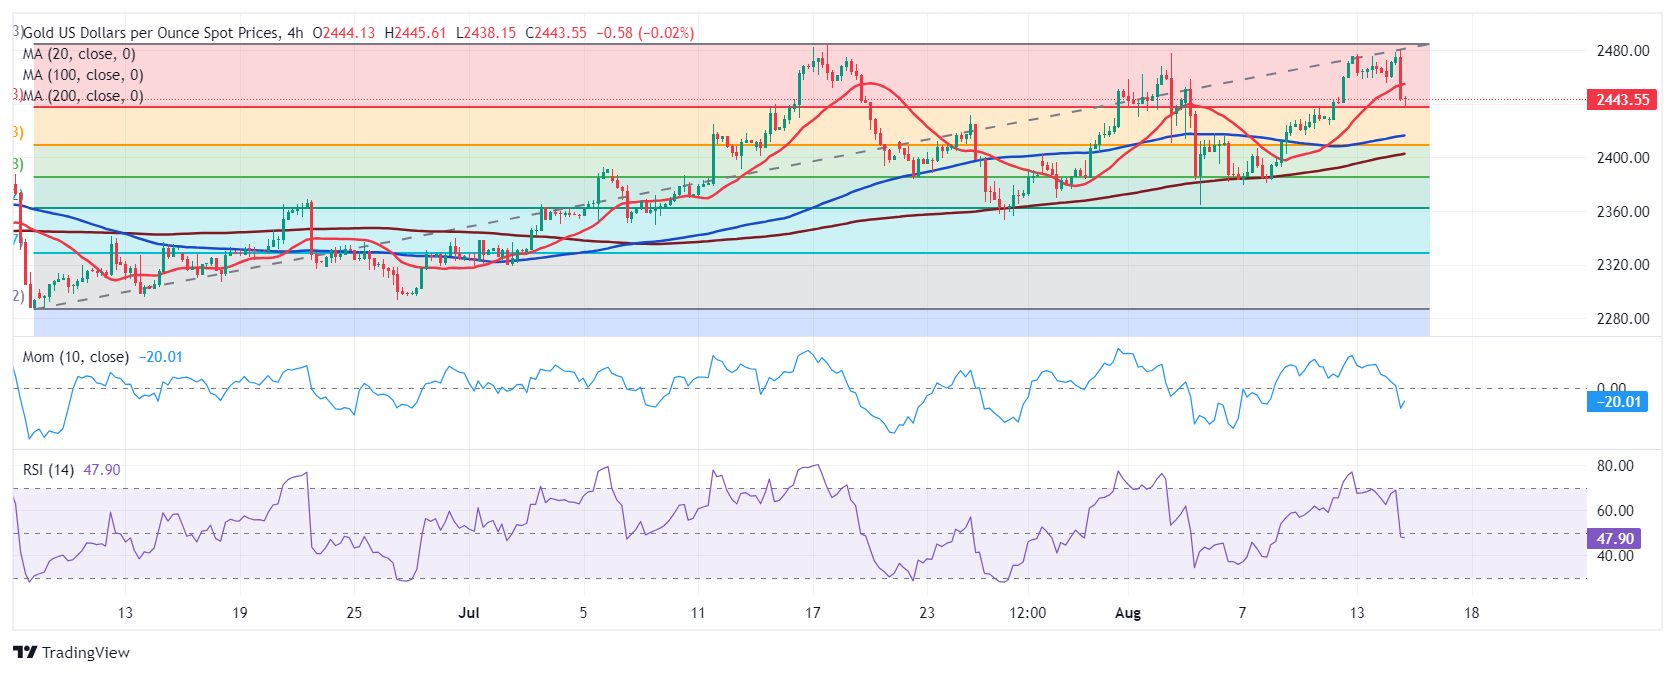
From a technical perspective, the daily chart for XAU/USD suggests the bearish potential remains limited. The pair found an intraday bottom at around the 23.6% Fibonacci retracement of the June/July rally at $2,438.80, now holding above the level. At the same time, technical indicators have lost their upward strength but remain within positive levels. Only the Relative Strength Index (RSI) turned south but stays far from confirming another leg south. Finally, XAU/USD keeps developing above all its moving averages, with the 20 Simple Moving Average (SMA) now flat at around $2,417.50.
Technical readings in the 4-hour chart, however, show the slide may continue, particularly if XAU/USD slides below the aforementioned Fibonacci support. Technical indicators retreated sharply from near overbought readings and are currently hovering around their midlines, partially losing the bearish momentum but still heading south. At the same time, XAU/USD broke below its 20 SMA, which stands at around $2,455.00. The 100 and 200 SMAs remain below the current level, somehow suggesting a steeper decline is not yet on the cards.
Support levels: 2,438.80 2,4260.90 2,438.80
Resistance levels: 2,458.70 2,471.10 2,483.70
Information on these pages contains forward-looking statements that involve risks and uncertainties. Markets and instruments profiled on this page are for informational purposes only and should not in any way come across as a recommendation to buy or sell in these assets. You should do your own thorough research before making any investment decisions. FXStreet does not in any way guarantee that this information is free from mistakes, errors, or material misstatements. It also does not guarantee that this information is of a timely nature. Investing in Open Markets involves a great deal of risk, including the loss of all or a portion of your investment, as well as emotional distress. All risks, losses and costs associated with investing, including total loss of principal, are your responsibility. The views and opinions expressed in this article are those of the authors and do not necessarily reflect the official policy or position of FXStreet nor its advertisers. The author will not be held responsible for information that is found at the end of links posted on this page.
If not otherwise explicitly mentioned in the body of the article, at the time of writing, the author has no position in any stock mentioned in this article and no business relationship with any company mentioned. The author has not received compensation for writing this article, other than from FXStreet.
FXStreet and the author do not provide personalized recommendations. The author makes no representations as to the accuracy, completeness, or suitability of this information. FXStreet and the author will not be liable for any errors, omissions or any losses, injuries or damages arising from this information and its display or use. Errors and omissions excepted.
The author and FXStreet are not registered investment advisors and nothing in this article is intended to be investment advice.
Recommended Content
Editors’ Picks

EUR/USD extends recovery beyond 1.0400 amid Wall Street's turnaround
EUR/USD extends its recovery beyond 1.0400, helped by the better performance of Wall Street and softer-than-anticipated United States PCE inflation. Profit-taking ahead of the winter holidays also takes its toll.

GBP/USD nears 1.2600 on renewed USD weakness
GBP/USD extends its rebound from multi-month lows and approaches 1.2600. The US Dollar stays on the back foot after softer-than-expected PCE inflation data, helping the pair edge higher. Nevertheless, GBP/USD remains on track to end the week in negative territory.

Gold rises above $2,620 as US yields edge lower
Gold extends its daily rebound and trades above $2,620 on Friday. The benchmark 10-year US Treasury bond yield declines toward 4.5% following the PCE inflation data for November, helping XAU/USD stretch higher in the American session.

Bitcoin crashes to $96,000, altcoins bleed: Top trades for sidelined buyers
Bitcoin (BTC) slipped under the $100,000 milestone and touched the $96,000 level briefly on Friday, a sharp decline that has also hit hard prices of other altcoins and particularly meme coins.

Bank of England stays on hold, but a dovish front is building
Bank of England rates were maintained at 4.75% today, in line with expectations. However, the 6-3 vote split sent a moderately dovish signal to markets, prompting some dovish repricing and a weaker pound. We remain more dovish than market pricing for 2025.

Best Forex Brokers with Low Spreads
VERIFIED Low spreads are crucial for reducing trading costs. Explore top Forex brokers offering competitive spreads and high leverage. Compare options for EUR/USD, GBP/USD, USD/JPY, and Gold.