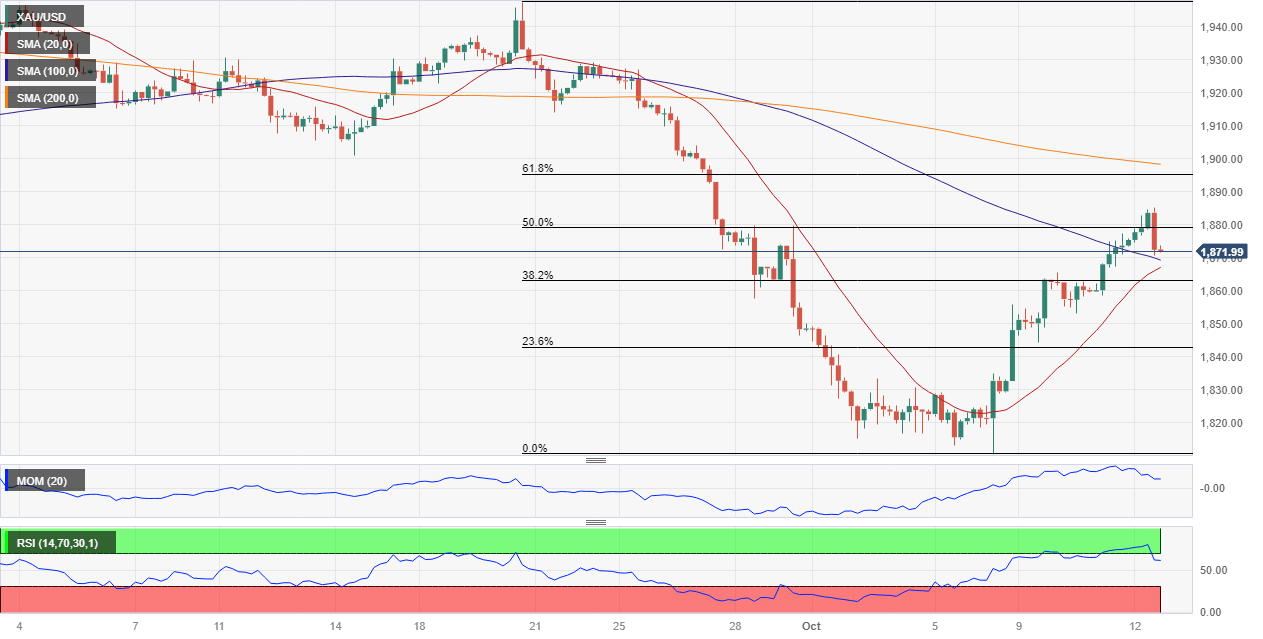
XAU/USD Current price: $1,871.98
- The US Consumer Price Index was higher than anticipated in September.
- US Treasury yields surged, pushing the US Dollar higher across the board.
- XAU/USD eases from fresh weekly highs, aims to extend the intraday slide.
Spot gold eased from a fresh weekly high of $1,885.01 a troy ounce following the release of American data, currently trading at around $1,872. The US Dollar remained under pressure throughout the first half of the day as the better performance of high-yielding equities limited demand for the safe-haven currency.
Investors were waiting for the United States (US) inflation update while looking at weaker government bond yields. Finally, the country reported that the Consumer Price Index (CPI) rose by 0.4% MoM in September and 3.7% from a year earlier, higher than anticipated. The annual core CPI printed at 4.1%, meeting expectations while easing from the previous 4.3%. At the same time, the country released Initial Jobless Claims for the week ended October 6, which resulted in 209K, slightly better than the 210K expected.
The USD surged with the news as the figures opposed the Federal Reserve’s wishes for cooler inflation and a loose labor market. Treasury yields picked up, with the 10-year note now offering 4.65% and the 2-year note yielding 5.07%. Ironically, Fed officials noted that higher yields could offset the need for additional rate hikes, with market fears doing policymakers’ job.
XAU/USD short-term technical outlook
XAU/USD trimmed early gains and trades with modest intraday losses. The daily chart shows that it briefly traded above a bearish 20 Simple Moving Average (SMA), which currently converges with the 50% retracement of the latest daily slump at $1,878.60. At the same time, the 100 SMA crossed below the 200 SMA, roughly $50 above the current level. Finally, technical indicators lost their upward strength and turned marginally lower within negative levels, hinting at another leg lower before the weekend.
The 4-hour chart shows XAU/USD is currently around a bearish 100 SMA, while the 20 SMA keeps advancing below the current level. The Momentum indicator consolidates within positive levels, while the Relative Strength Index (RSI) indicator corrected overbought conditions, heading south far above its midline. The 38.2% retracement of the aforementioned decline provides immediate support at $1,862.70, with a steeper decline expected on a break below it.
Support levels: 1,862.70 1,853.00 1,844.10
Resistance levels: 1,878.60 1,891.40 1,904.70
Information on these pages contains forward-looking statements that involve risks and uncertainties. Markets and instruments profiled on this page are for informational purposes only and should not in any way come across as a recommendation to buy or sell in these assets. You should do your own thorough research before making any investment decisions. FXStreet does not in any way guarantee that this information is free from mistakes, errors, or material misstatements. It also does not guarantee that this information is of a timely nature. Investing in Open Markets involves a great deal of risk, including the loss of all or a portion of your investment, as well as emotional distress. All risks, losses and costs associated with investing, including total loss of principal, are your responsibility. The views and opinions expressed in this article are those of the authors and do not necessarily reflect the official policy or position of FXStreet nor its advertisers. The author will not be held responsible for information that is found at the end of links posted on this page.
If not otherwise explicitly mentioned in the body of the article, at the time of writing, the author has no position in any stock mentioned in this article and no business relationship with any company mentioned. The author has not received compensation for writing this article, other than from FXStreet.
FXStreet and the author do not provide personalized recommendations. The author makes no representations as to the accuracy, completeness, or suitability of this information. FXStreet and the author will not be liable for any errors, omissions or any losses, injuries or damages arising from this information and its display or use. Errors and omissions excepted.
The author and FXStreet are not registered investment advisors and nothing in this article is intended to be investment advice.
Recommended Content
Editors’ Picks

EUR/USD remains offered and challenges 1.0800
The intense recovery in the US Dollar keeps the price action in the risk complex depressed, forcing EUR/USD to recede further and put the key support at 1.0800 to the test on Friday.

GBP/USD breaks below 1.2900 on stronger Dollar
Persistent buying pressure on the Greenback has pushed GBP/USD to multi-day lows below the 1.2900 level, as investors continue to digest the recent interest rate decisions from both the Fed and the BoE.

Gold meets support around the $3,000 mark
The combined impact of a stronger US Dollar, continued profit taking, and the effects of Quadruple Witching weighed on Gold, pulling its troy ounce price down to around the pivotal $3,000 level on Friday.

US SEC Crypto Task Force to host the first-ever roundtable on crypto asset regulation
The US Securities and Exchange Commission (SEC) Crypto Task Force will host a series of roundtables to discuss key areas of interest in regulating crypto assets. The “Spring Sprint Toward Crypto Clarity” series’ first-ever roundtable begins on Friday.

Week ahead – Flash PMIs, US and UK inflation eyed as tariff war rumbles on
US PCE inflation up next, but will consumption data matter more? UK budget and CPI in focus after hawkish BoE decision. Euro turns to flash PMIs for bounce as rally runs out of steam. Inflation numbers out of Tokyo and Australia also on the agenda.

The Best brokers to trade EUR/USD
SPONSORED Discover the top brokers for trading EUR/USD in 2025. Our list features brokers with competitive spreads, fast execution, and powerful platforms. Whether you're a beginner or an expert, find the right partner to navigate the dynamic Forex market.
