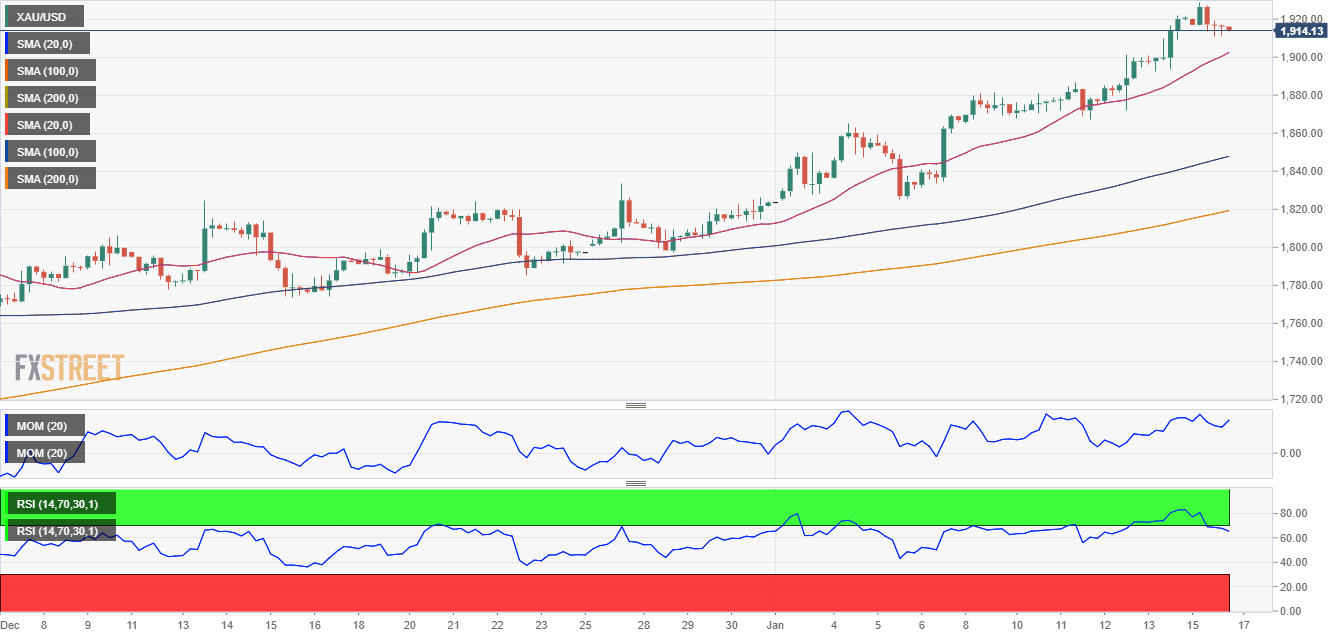
XAU/USD Current price: $1,914.10
- Financial markets eye global government bond yields for direction.
- Inflation figures will likely shed light on the world’s economic health this week.
- XAU/USD retreats from a fresh nine-month high, retains its bullish bias.
Spot gold rallied on Monday to $1,928,93 a troy ounce, its highest since April 2022, as the market optimism weighed on the US Dollar. The Greenback trimmed early losses and stabilized around its opening levels across the FX board, with XAU/USD hovering around $1,914. It is worth noting that the United States celebrates the Martin L. King holiday, which means most local markets are closed.
Asian stock markets closed mixed after a strong start to the day, undermining the positive mood. The main focus was on Japan Government Bonds (JGBs) as the yield on the 10-year note surged to 0.52%, pushing the upper end of the BoJ’s range. The Bank of Japan is having a monetary policy meeting this week, and rising yields spurred speculation policymakers will finally introduce a shift in their monetary policy. Governor Haruhiko Kuroda’s term ends next April, and speculative interest believes he will introduce changes to the ultra-loose policy before leaving.
Other than that, investors will be paying attention to global inflation figures this week, as the United Kingdom, the Euro Zone, Germany and Canada will post updates on price pressures. The United States macroeconomic calendar will remain scarce, with Retail Sales being the most relevant release.
XAU/USD price short-term technical outlook
The daily chart for the XAU/USD pair shows that technical indicators are barely retreating from extreme overbought readings, far from confirming an interim top. In fact, the Relative Strength Index (RSI) hovers around 72, somehow suggesting bulls are not willing to give up. At the same time, the pair is developing far above its moving averages, with the 20 Simple Moving Average (SMA) heading firmly north and providing dynamic support at around $1,840.40.
The 4-hour chart shows that bulls retain control of the pair. Technical indicators turned flat within positive levels after correcting extreme overbought readings, reflecting the absence of selling interest. At the same time, moving averages head firmly north, far below the current level, with the 20 SMA currently at around $1,899.70.
Support levels: 1,910.80 1,899.70 1,884.60
Resistance levels: 1,919.30 1,930.00 1,941.85
Information on these pages contains forward-looking statements that involve risks and uncertainties. Markets and instruments profiled on this page are for informational purposes only and should not in any way come across as a recommendation to buy or sell in these assets. You should do your own thorough research before making any investment decisions. FXStreet does not in any way guarantee that this information is free from mistakes, errors, or material misstatements. It also does not guarantee that this information is of a timely nature. Investing in Open Markets involves a great deal of risk, including the loss of all or a portion of your investment, as well as emotional distress. All risks, losses and costs associated with investing, including total loss of principal, are your responsibility. The views and opinions expressed in this article are those of the authors and do not necessarily reflect the official policy or position of FXStreet nor its advertisers. The author will not be held responsible for information that is found at the end of links posted on this page.
If not otherwise explicitly mentioned in the body of the article, at the time of writing, the author has no position in any stock mentioned in this article and no business relationship with any company mentioned. The author has not received compensation for writing this article, other than from FXStreet.
FXStreet and the author do not provide personalized recommendations. The author makes no representations as to the accuracy, completeness, or suitability of this information. FXStreet and the author will not be liable for any errors, omissions or any losses, injuries or damages arising from this information and its display or use. Errors and omissions excepted.
The author and FXStreet are not registered investment advisors and nothing in this article is intended to be investment advice.
Recommended Content
Editors’ Picks

EUR/USD extends slide toward 1.0300, touches new two-year low
EUR/USD stays under bearish pressure and trades at its lowest level since December 2022 below 1.0350 on Thursday. The pair turned south amid a resurgent US Dollar demand and worsening market mood. Investors stay cautious at the onset of 2025, awaiting the US jobs data for fresh incentives.

GBP/USD slumps to multi-month lows below 1.2450
Following an earlier recovery attempt, GBP/USD reversed its direction and declined to its weakest level in nearly eight months below 1.2450. The renewed US Dollar (USD) strength on worsening risk mood weighs on the pair as markets await mid-tier data releases.

Gold benefits from risk aversion, climbs above $2,640
Gold gathers recovery momentum and trades at a two-week-high above $2,640 heading into the American session on Thursday. The precious metal benefits from the sour market mood and the pullback seen in the US Treasury bond yields.

XRP rockets 11% as Bitcoin starts New Year with bullish bang
Crypto majors zoomed higher in the past 24 hours as the market entered a widely expected bullish year, with Bitcoin inching above $95,000 to shake off losses from last week. XRP surged 11% to lead growth among majors as of Thursday, led by $1.3 billion worth of trading volumes on Korea-focused exchange UpBit.

Three Fundamentals: Year-end flows, Jobless Claims and ISM Manufacturing PMI stand out Premium
Money managers may adjust their portfolios ahead of the year-end. Weekly US Jobless Claims serve as the first meaningful release in 2025. The ISM Manufacturing PMI provides an initial indication ahead of Nonfarm Payrolls.

Best Forex Brokers with Low Spreads
VERIFIED Low spreads are crucial for reducing trading costs. Explore top Forex brokers offering competitive spreads and high leverage. Compare options for EUR/USD, GBP/USD, USD/JPY, and Gold.
