Gold Price Forecast: XAU/USD ranges below record highs as focus shifts to US GDP data
- Gold price finds demand but remains within a familiar range below record highs.
- The US Dollar stays depressed alongside US Treasury yields, eyeing the US Q4 advance GDP report.
- The daily technical setup continues to favor Gold buyers as record highs remain in sight.

Gold price is back in demand early Thursday, holding its fort above $2,750. Despite the rebound, Gold price remains in a familiar range below the record high of $2.790 as traders look forward to the US fourth-quarter advance Gross Domestic Product (GDP) report for fresh impetus.
Will Gold price retest record highs on US GDP slowdown?
Gold buyers are trying their luck in Asian trading on Thursday, helped by a subdued performance of the US Dollar (USD) and the US Treasury bond yields as traders digest the latest US Federal Reserve (Fed) policy decision in the face of looming tariffs by President Donald Trump on Canada, Mexico and China as soon as this weekend.
Meanwhile, markets remained wary of the mixed earnings results from the US tech titans Meta, Tesla, and Microsoft released after the market close. Meta’s sales in the fourth quarter jumped 21% year over year while net income grew 49% to $20.8 billion from $14 billion a year earlier. Microsoft slipped on weak quarterly revenue guidance while Tesla Inc. shares rallied as much as 4% in extended trading on Wednesday despite the company reporting a disappointing quarter on both revenue and the profit front.
Expectations of a slowdown in the US economic growth also revive the safe-haven appeal of the Gold price. The US economy is expected to grow at an annualized pace of 2.6% in Q4 2024 after expanding 3.1% in the prior quarter. The widening US trade deficit in goods suggests that the advance GDP data could be weaker than the market forecasts.
Faltering US economic growth prospects and looming trade war risks under Trump’s presidency could keep the buoyant tone intact around the traditional store of value – Gold. Also of note will be the weekly US Jobless Claims and the quarterly Personal Consumption Expenditures (PCE) Prices data.
On Wednesday, Gold price returned to the red following a hawkish hold Fed decision as perceived by market participants. The Fed held the benchmark policy rate in the 4.25%-4.50% target range but altered the language in the policy statement to a slightly hawkish tone. The US central bank removed the earlier statement saying that inflation "has made progress" towards its 2% inflation goal while noting only the pace of price increases "remains elevated."
Additionally, Fed Chairman Jerome Powell, in his post-policy press conference, the Fed wants to see further progress on inflation and could see a pathway for that, adding, “we don't need to be in a hurry to make any adjustments.”
Traders are pricing in around 46 basis points (bps) of cuts by year-end, a tad lower than around 48 bps before the Fed statement, indicating waning expectations for two Fed rate cuts this year, per Reuters.
However, gold prices managed to stage a modest rebound late Wednesday as the USD failed to sustain Fed-inspired gains. US Treasury bond yields slipped amid souring mood as traders remained cautious ahead of the earnings results from US tech giants - Microsoft, Tesla and Meta.
Gold price technical analysis: Daily chart
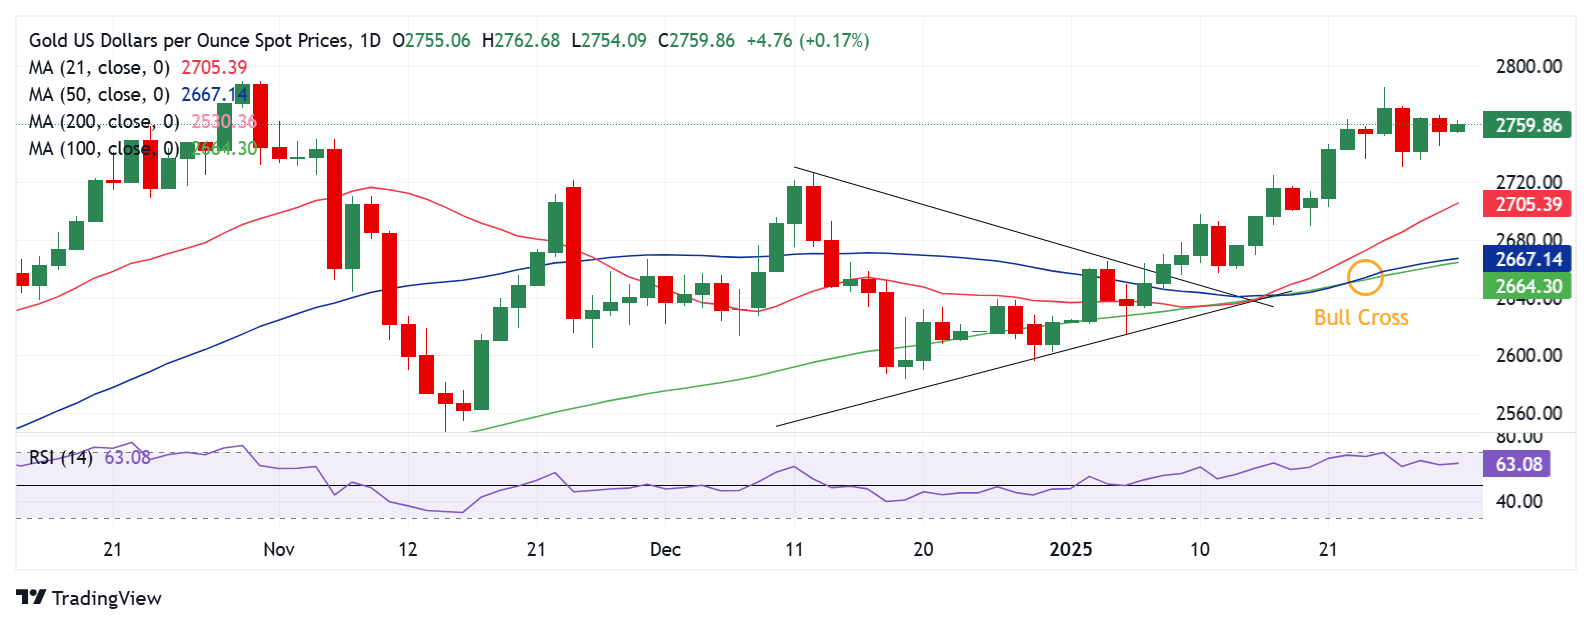
The short-term technical outlook for Gold price remains bullish, making it a ‘buy-the-dips’ trade.
The 14-day Relative Strength Index (RSI) holds comfortably above the midline, currently near 63, keeping Gold buyers hopeful.
Adding credence to the bullish potential, the 50-day SMA closed above the 100-day SMA last Thursday, confirming a Bull Cross.
Gold price needs a sustained move above the static resistance at around $2,765 to take on the upside.
However, a daily candlestick closing above the symmetrical triangle target of $2,785 or record high of $2,790 is critical to initiating a fresh uptrend.
The next relevant upside targets are $2,800 and the $2,850 psychological barrier.
On the downside, the immediate support will be seen at the previous day’s low of $2,745.
Sellers will then aim for this week’s low of $2,731, folowed by the $2,700 round level, where the 21-day SMA coincides.
Premium
You have reached your limit of 3 free articles for this month.
Start your subscription and get access to all our original articles.
Author

Dhwani Mehta
FXStreet
Residing in Mumbai (India), Dhwani is a Senior Analyst and Manager of the Asian session at FXStreet. She has over 10 years of experience in analyzing and covering the global financial markets, with specialization in Forex and commodities markets.


