Gold Price Forecast: XAU/USD pressuring a critical support level

XAU/USD Current price: $1,935.85
- The United States ADP survey on private job creation beat expectations in July.
- Stocks plunged after Fitch Ratings downgraded the US debt rating from AAA to AA+.
- XAU/USD struggles around a Fibonacci support level, aims to retest $1,833.
The US Dollar suffered a short-lived setback early on Wednesday but recovered its poise mid-European morning. The XAU/USD pair peaked at $1,954.81 a troy ounce but currently trades at around $1,935 as a dismal market mood and encouraging United States (US) data backs the Greenback.
The US published the ADP Employment Change survey, which showed that the private sector added 324K new job positions in July, much better than the 189K anticipated by financial markets. The news came ahead of the Nonfarm Payrolls report (NFP) to be released next Friday and suggests the labor market remains tight, allowing the Federal Reserve (Fed) to continue with the monetary tightening policy.
At this point, however, financial markets believe the Fed central bank will deliver one more 25 basis point (bps) rate hike after delivering a similar hike last week, lifting the key benchmark rate to 5.25%-5.50%. That would translate into a soft landing instead of a steep recession. Unemployment remains near record lows, yet signs of the economy turning the corner are tepid, to say the least. Speculative interest is optimistic but cautious, with employment-related figures in the eye of the storm.
Meanwhile, Fitch Ratings downgraded the US debt rating from AAA to AA+ on Tuesday amid the debt ceiling turmoil. The news kept markets in risk-off mode, with global indexes trading in the red and government bond yields extending their weekly rally. Currently, the yield on the 10-year US Treasury note stands at 4.09%, up 4 basis points. On a positive note, the 2-year yield is unchanged at 4.90%.
XAU/USD price short-term technical outlook
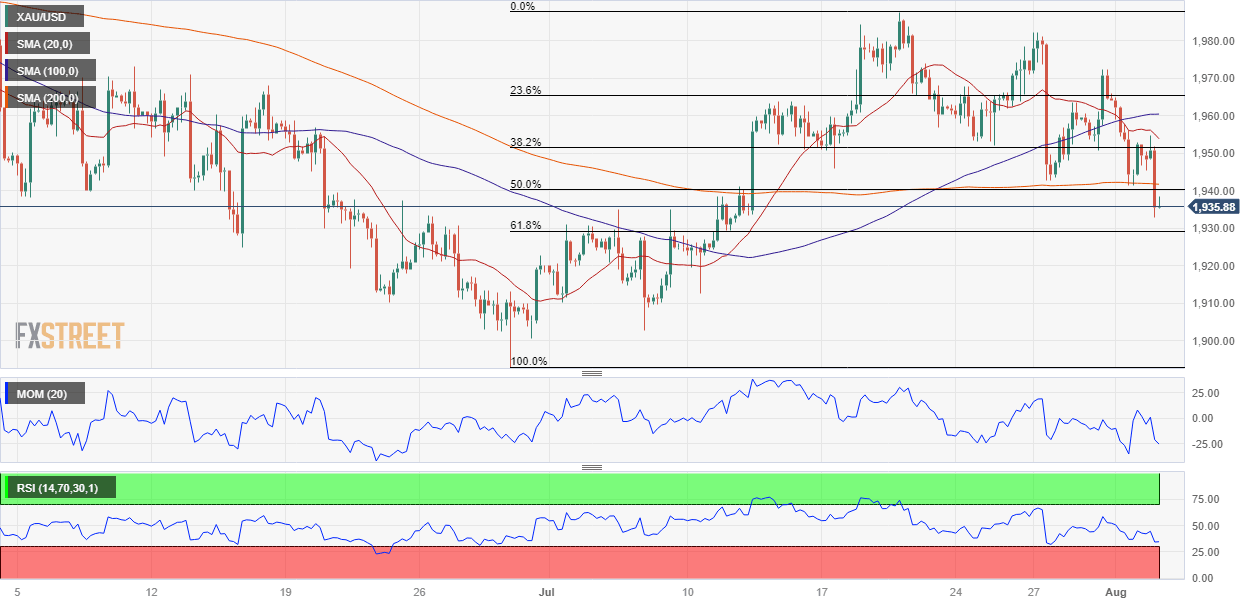
The XAU/USD pair is currently trading around the 61.8% Fibonacci retracement of its latest daily run measured between $1,902.62 and $1,987.40 at $1,934.84, and bearish, according to technical readings in the daily chart. Gold has met sellers around a still bullish 20 Simple Moving Average (SMA),, which develops below a flat 100 SMA. Technical indicators, in the meantime, gain downward traction below their midlines.
The bearish case is clearer in the 4-hour chart, with technical indicators heading south almost vertically and approaching oversold readings without signs of bearish exhaustion. Furthermore, the pair is developing below all its moving averages, with the 20 SMA accelerating south below the 100 SMA, both above the 200 SMA.
Support levels: 1,922.95 1,911.80 1,898.10
Resistance levels: 1,944.95 1,954.70 1,966.90
Premium
You have reached your limit of 3 free articles for this month.
Start your subscription and get access to all our original articles.
Author

Valeria Bednarik
FXStreet
Valeria Bednarik was born and lives in Buenos Aires, Argentina. Her passion for math and numbers pushed her into studying economics in her younger years.


