Gold Price Forecast: XAU/USD nearing critical support at $1,932.00

XAU/USD Current price: $1,941.30
- The Bank of Canada unexpectedly hiked the benchmark rate by 25 basis points.
- Financial markets increasingly concerned about Federal Reserve’s next movement.
- XAU/USD plummeted amid renewed US Dollar demand, nears May monthly low.
XAU/USD is in retreat mode after peaking at $1,970.15 a troy ounce, now approaching the $1,940 mark. The US Dollar started the day on the back foot as the market mood stabilized, allowing rival assets to appreciate. However, the American currency made a comeback early in the US session, helped by rising US government bond yields.
The USD benefited from renewed speculation the US Federal Reserve (Fed) could pull the trigger next week and go for another 25 basis points (bps) rate hike. Odds for a no change are still high but decreased from over 75% to 64.4%, according to the CME FedWatch Tool. The catalyst was the Bank of Canada (BoC) monetary policy announcement as the central bank unexpectedly hiked rates by 25 bps. Earlier in the week, the Reserve Bank of Australia (RBA) did the same, putting at doubt the end of the tightening cycle in the United States.
Following an encouraging opening, US stock indexes trade mixed, reflecting the ongoing uncertainty about the Fed’s next move. At the time being, the Dow Jones Industrial Average trades in the green, but the S&P500 and the Nasdaq Composite are down, with the latter being the worst performer. Meanwhile, the 10-year Treasury note currently yields 3.78%, up 8 pbs, while the 2-year note offers 4.58%, adding 6 bps on the day.
XAU/USD price short-term technical outlook
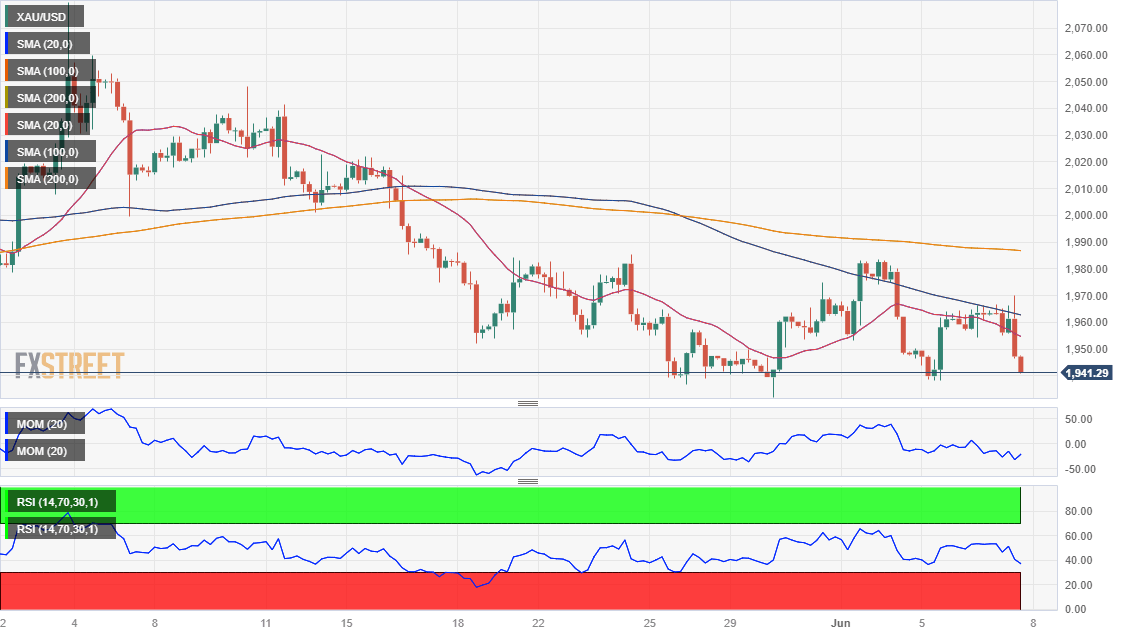
XAU/USD daily chart shows that it met sellers around a firmly bearish 20 Simple Moving Average (SMA) while it currently nears the 100 SMA, which has been providing dynamic support in the last few days. At the same time, the Momentum indicator turned flat below its 100 level, while the Relative Strength Index (RSI) gains downward traction at around 41. Overall, the risk skews to the downside, with May low at $1.932.00, providing immediate and relevant support.
In the near term, and according to the 4-hour chart, chances are of a continued decline, given the failure to retain gains above a Fibonacci level, the 23.6% retracement of the latest daily slump at $1,966.20, and the subsequent collapse. XAU/USD currently develops below all its moving averages as technical indicators head sharply south, although the Momentum remains within neutral levels. Nevertheless, a test of the May low is on the table, while once below it, sellers will look to test the $1,900 area.
Support levels: 1,932.00 1,918.00 1,903.80
Resistance levels: 1,954.30 1,966.20 1,987.65
Premium
You have reached your limit of 3 free articles for this month.
Start your subscription and get access to all our original articles.
Author

Valeria Bednarik
FXStreet
Valeria Bednarik was born and lives in Buenos Aires, Argentina. Her passion for math and numbers pushed her into studying economics in her younger years.


