Gold Price Forecast: XAU/USD lacks directional bias, awaits US Retail Sales for a range breakout
- Gold remains trapped in a narrow range so far this week.
- XAU bulls fail to take advantage of the US dollar’s weakness.
- Geopolitical risks lurk, with eyes on critical US Retail Sales for fresh direction.

Gold (XAU/USD) returned to the red on Wednesday, although remained confined within the recent trading range, awaiting a strong catalyst for a clear direction. The yellow metal tumbled, as the US Treasury yields embarked upon a steady recovery amid infrastructure stimulus optimism, higher inflation expectations, successful covid vaccine rollouts in the country. However, the extended sell-off in the US dollar and mixed performance on Wall Street indices helped limit the declines in gold. The greenback remains undermined by the tempered expectations of the Fed’s tapering after the latest US CPI report failed to re-ignite fears over rising inflation.
At the time of writing, gold posts small gains, bouncing back towards $1750 despite the US dollar’s corrective pullback from multi-week troughs. The risk-off mood could offer some support to the traditional safe-haven gold. Investors remain nervous amid growing China worries and concerns over potential US sanctions on the Russian sovereign debt. Also, covid vaccine developments continue to have a bearing on the risk tone.
Going forward, all eyes remain on the US Retail Sales data for March, which is expected to show a sharp rebound in consumer spending. Stronger data could point to strengthening domestic consumption, in turn, suggesting a potential rise in prices. In the meantime, gold will likely remain at the mercy of the dynamics in the yields and the dollar.
Gold Price Chart - Technical outlook
Gold: Daily chart
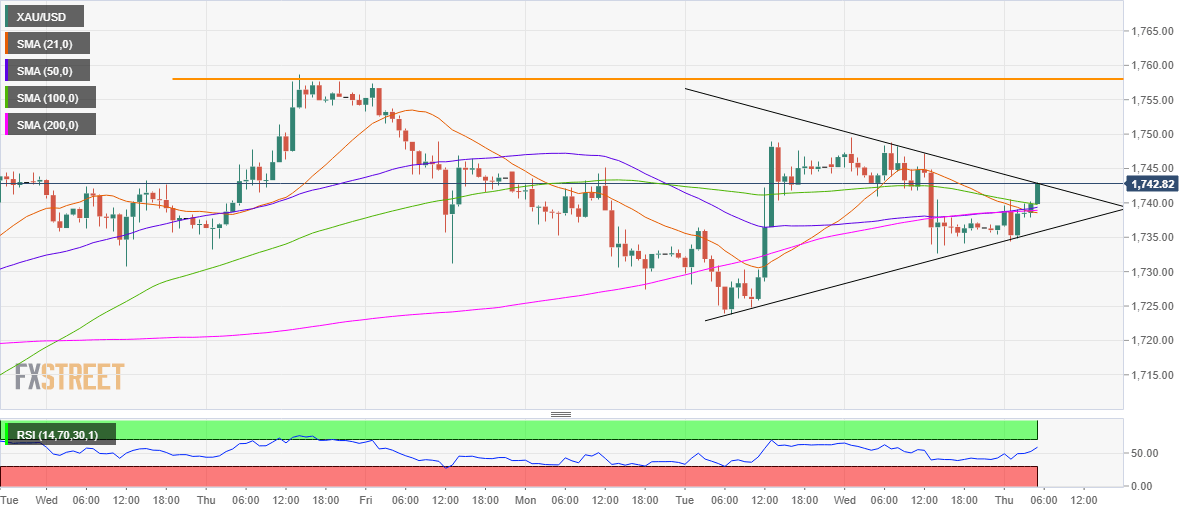
As observed in gold’s daily chart, the price remains trapped between the 21 and 50-daily moving averages (DMAs) for the ninth straight session.
The range is getting tighter each passing day and hence, it could be assumed that the US data could offer that much-needed breakout, which could be in either direction.
However, with the 14-day Relative Strength Index (RSI) holding firmer above the midline, an upside break cannot be ruled out.
Gold needs a daily closing above the bearish 50-DMA at $1752 to unleash additional gains.
The April 8 high at $1759 could then challenge the bulls’ commitments, as the $1800 mark beckons.
Alternatively, if the sellers find a strong foothold below the horizontal 21-DMA at $1734, a drop towards the April 13 low could be in the offing.
Further south, the bears could then target the April 1 low of $1706.
Premium
You have reached your limit of 3 free articles for this month.
Start your subscription and get access to all our original articles.
Author

Dhwani Mehta
FXStreet
Residing in Mumbai (India), Dhwani is a Senior Analyst and Manager of the Asian session at FXStreet. She has over 10 years of experience in analyzing and covering the global financial markets, with specialization in Forex and commodities markets.


