Gold Price Forecast: XAU/USD keeps consolidating ahead of US first-tier figures

XAU/USD Current price: $2,328.21
- United States´ second round of tepid data weighed on Wall Street.
- Upcoming US data could speed up the Federal Reserve’s decision to trim rates.
- XAU/USD turned near-term neutral, bulls seem unwilling to give up.
Gold consolidative phase continued on Wednesday, with XAU/USD seesawing around $2,325.00 a troy ounce. Financial markets are gearing up for upcoming first-tier United States (US) data following a batch of discouraging figures. Following softer-than-anticipated S&P Global PMIs released on Monday, the country reported Durable Goods Orders rose 2.3% in March, missing the 2.5% anticipated. Furthermore, the February reading was downwardly revised to 1.5% from the previous estimate of 2.2%.
Overall, US data is showing the economy is not doing well enough for the Federal Reserve (Fed) to maintain rates at current record highs for as long as policymakers may want. Market participants are starting to suspect so and will get some certainties in the next couple of days. On Thursday, the US will release the preliminary estimate of the Q1 Gross Domestic Product (GDP), which is expected to show that the economy grew at an annualized pace of 2.5% in the three months to March. On Friday, the focus will shift to the March Personal Consumption Expenditures (PCE) Price Index, the Federal Reserve’s (Fed) favorite inflation gauge.
Meanwhile, intraday news affected Wall Street. US indexes trade with modest losses, unable to replicate the positive tone of their Asian and European counterparts. The US Dollar is also suffering from softer-than-anticipated figures, although activity remains limited across the different boards.
XAU/USD short-term technical outlook
XAU/USD keeps hovering around the 23.6% Fibonacci retracement of the $1,996.06/$2,431.43 rally, unable to clearly recover above the level. The daily chart shows the pair is also stuck around a bullish 20 Simple Moving Average (SMA), while technical indicators lack directional strength just above their midlines. It seems that sellers are not yet willing to jump in while buyers are making tepid attempts to resume the rally.
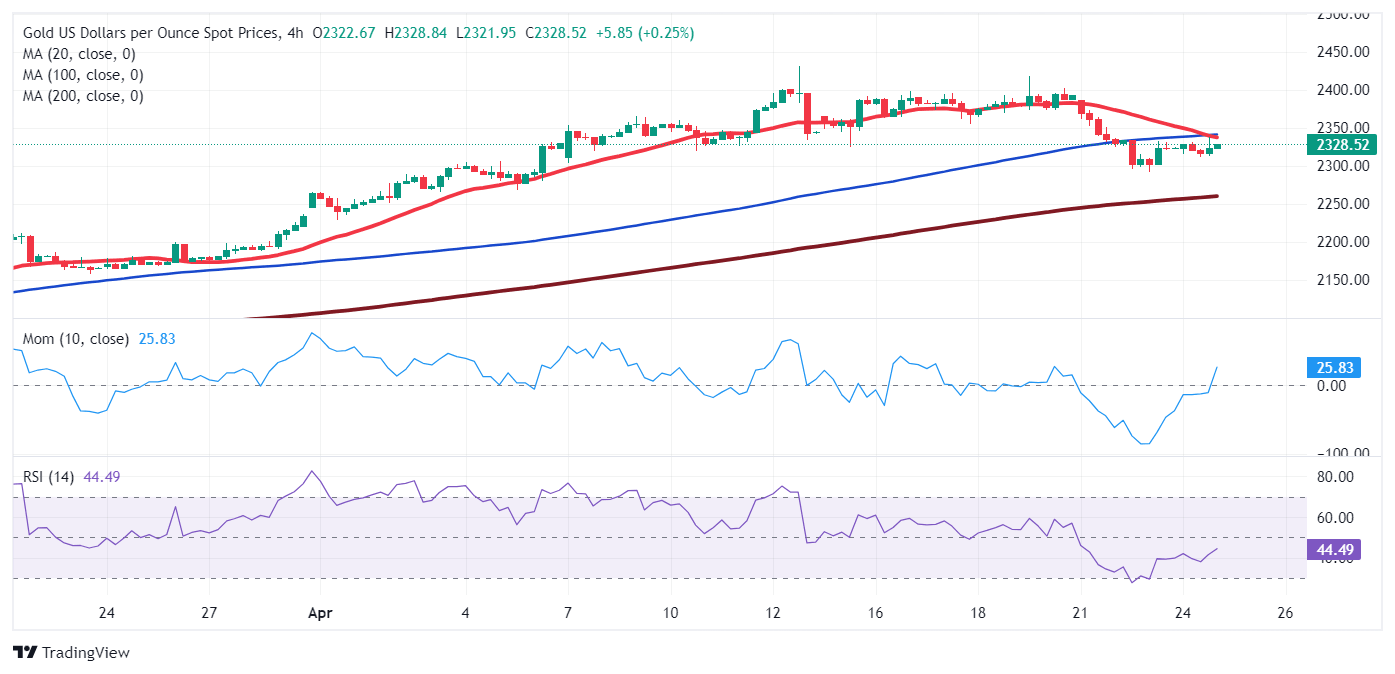
Technical readings in the 4-hour chart show limited bullish potential, as the pair trades below the 20 and 100 Simple Moving Averages (SMAs), with the shorter one accelerating south below the longer one, usually seen as a sign of growing selling pressure. Technical indicators, in the meantime, remain within negative levels, with the Momentum indicator advancing and the Relative Strength Index (RSI) indicator consolidating around 43.
Support levels: 2,310.00 2,295.20 2,282.90
Resistance levels: 2,348.30 2,361.55 2,372.90
Premium
You have reached your limit of 3 free articles for this month.
Start your subscription and get access to all our original articles.
Author

Valeria Bednarik
FXStreet
Valeria Bednarik was born and lives in Buenos Aires, Argentina. Her passion for math and numbers pushed her into studying economics in her younger years.


