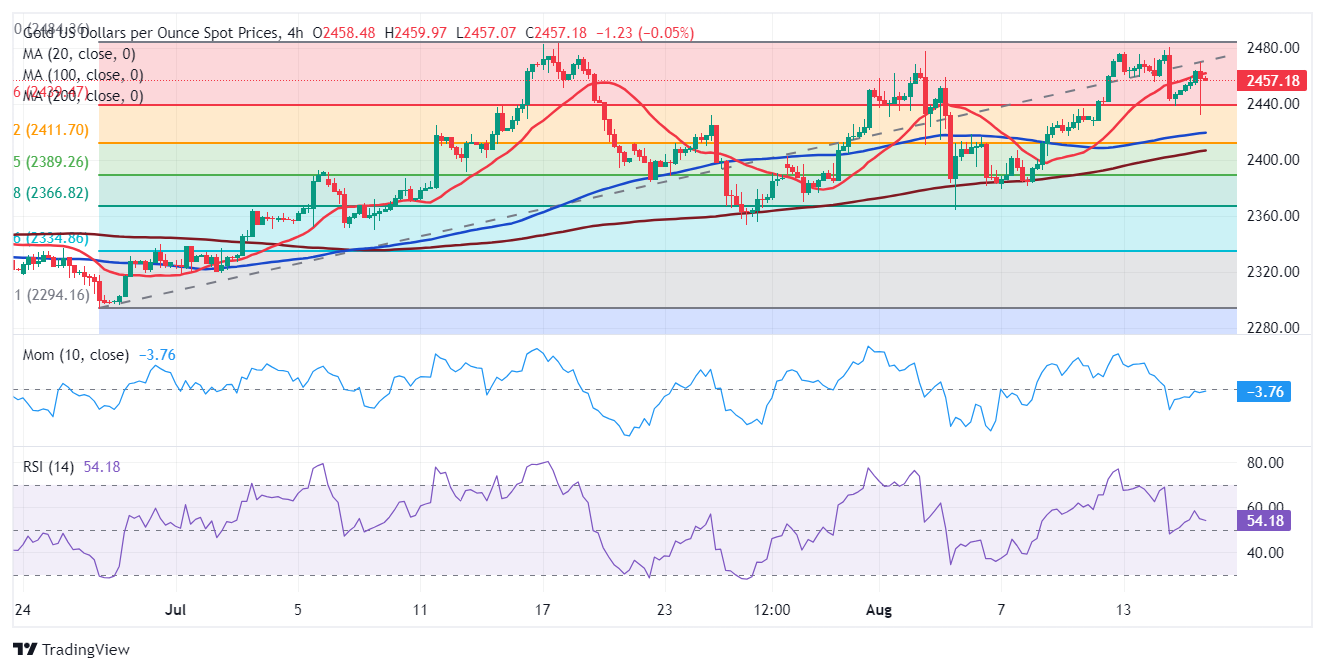
XAU/USD Current price: $2,457.30
- Financial markets welcomed US data pushing away recession-related fears.
- Stock markets are rallying with optimism, with US indexes challenging fresh weekly highs.
- XAU/USD holds within familiar levels, buyers still take their chances on dips.

Spot Gold trades with modest gains in the American afternoon, having experienced some early volatility. XAU/USD fell to $2,432.04 ahead of Wall Street’s opening as a batch of United States (US) data pushed speculative interest away from the safe-haven metal. Financial markets welcomed news that US Retail Sales rose by 1% in July, far better than the 0.3% advance anticipated. Furthermore, Initial Jobless Claims rose by less than anticipated in the week ending August 9, up 227K vs the 235K forecast.
The US Dollar surged with the news against all major rivals, while US indexes also advanced, as the numbers spooked fears of a recession while maintaining unchanged the odds for an upcoming Federal Reserve (Fed) interest rate cut. Stock markets remained optimistic after the opening, extending gains to fresh weekly highs, but the USD retreated. The second batch of US data was less encouraging, as Capacity Utilization hit 77.8% in July while Industrial Production in the same month was down 0.6%, both worse than expected and below June figures.
XAU/USD short-term technical outlook
The daily chart for the XAU/USD pair shows it remains within familiar levels, and while trading in the green, it posted a lower high and a lower low, usually seen as a bearish sign. Technical indicators have turned marginally lower but remain within positive levels, limiting the odds of a steeper decline. Finally, the pair keeps developing above all its moving averages, with the 20 Simple Moving Average (SMA) flat above bullish 100 and 200 SMAs. Overall, the case of a steeper leg lower seems unlikely.
In the near term, and according to the 4-hour chart, the pair is neutral-to-bullish. Technical indicators turned higher, but remain at around their midlines. Meanwhile, a mildly bullish 20 SMA provides dynamic resistance a few $ above the current level, while the longer moving averages extended their modest upward slopes below the current level. More relevantly, buyers defend the downside at around the 23.6% Fibonacci retracement of the June/July rally at $2,438.80.
Support levels: 2,438.80 2,4260.90 2,438.80
Resistance levels: 2,471.10 2,483.70 2,495.00
Information on these pages contains forward-looking statements that involve risks and uncertainties. Markets and instruments profiled on this page are for informational purposes only and should not in any way come across as a recommendation to buy or sell in these assets. You should do your own thorough research before making any investment decisions. FXStreet does not in any way guarantee that this information is free from mistakes, errors, or material misstatements. It also does not guarantee that this information is of a timely nature. Investing in Open Markets involves a great deal of risk, including the loss of all or a portion of your investment, as well as emotional distress. All risks, losses and costs associated with investing, including total loss of principal, are your responsibility. The views and opinions expressed in this article are those of the authors and do not necessarily reflect the official policy or position of FXStreet nor its advertisers. The author will not be held responsible for information that is found at the end of links posted on this page.
If not otherwise explicitly mentioned in the body of the article, at the time of writing, the author has no position in any stock mentioned in this article and no business relationship with any company mentioned. The author has not received compensation for writing this article, other than from FXStreet.
FXStreet and the author do not provide personalized recommendations. The author makes no representations as to the accuracy, completeness, or suitability of this information. FXStreet and the author will not be liable for any errors, omissions or any losses, injuries or damages arising from this information and its display or use. Errors and omissions excepted.
The author and FXStreet are not registered investment advisors and nothing in this article is intended to be investment advice.
Recommended Content
Editors’ Picks

AUD/USD: Door open to extra weakness
AUD/USD retreated for the third consecutive day, breaking below the 0.6300 support to challenge the provisional 55-day SMA, always on the back of further gains in the Greenback and a poor labour market report in Australia.

EUR/USD eases on Thursday, slipping below 1.0900 once again
EUR/USD backslid for a second consecutive trading day, falling one-fifth of one percent on Thursday as markets continue to keep one foot in the safe haven US Dollar amid still-bubbling market tensions around the US’s waffling on tariff policy.

Gold corrective slide may be complete
After hitting a record high above $3,050 early Thursday, Gold retraced to the $3,030 region amid the stronger Dollar and diminishing US yields, all amid investors' repricing of the latest FOMC event.

Meme coin platform Pumpfun launches PumpSwap, promising creator revenue sharing
Solana meme coin generator Pumpfun announced on Thursday the launch of its own native decentralized exchange (DEX), PumpSwap, to facilitate the trading of meme coins and other SOL-based crypto tokens.

Tariff wars are stories that usually end badly
In a 1933 article on national self-sufficiency1, British economist John Maynard Keynes advised “those who seek to disembarrass a country from its entanglements” to be “very slow and wary” and illustrated his point with the following image: “It should not be a matter of tearing up roots but of slowly training a plant to grow in a different direction”.

The Best brokers to trade EUR/USD
SPONSORED Discover the top brokers for trading EUR/USD in 2025. Our list features brokers with competitive spreads, fast execution, and powerful platforms. Whether you're a beginner or an expert, find the right partner to navigate the dynamic Forex market.