Gold Price Forecast: XAU/USD faces extra upside near term
- Prices of Gold extended their march north to the $2,670 zone.
- The US Dollar maintained its bid bias amid higher US yields.
- XAU/USD’s immediate up-barrier now comes at $2,700/oz.

Gold prices extended their climb on Thursday, supported by steady geopolitical tensions, despite a firm session for the US Dollar (USD) and modest gains in US yields across the board.
The ongoing uncertainty surrounding the Russia-Ukraine conflict, combined with broader market instability, has underpinned the precious metal's strong rebound this week.
Gold marked its fourth consecutive session of gains, surpassing the $2,670 mark per troy ounce and shifting focus toward the critical $2,700 resistance level. This zone poses a significant challenge as bullion looks to build on its recovery momentum.
The rally also coincided with a stronger USD, bolstered by the ongoing "Trump-trade" rally, and US yields, which regained some strength across various maturities.
As the week progresses, attention will turn to key global economic data releases, with preliminary Purchasing Managers' Indexes (PMIs) set to take center stage toward the week's end.
Additionally, market participants are closely following comments from central bank officials, particularly after Federal Reserve Chair Jerome Powell’s recent cautious statements. Powell highlighted the resilience of the US economy but stressed the importance of prudence when evaluating potential future rate cuts.
Looking ahead, gold may face increased scrutiny as recent US economic data and expectations of inflationary Republican policies have heightened the likelihood of interest rates remaining elevated for an extended period. While gold is traditionally viewed as a hedge against inflation, higher interest rates tend to diminish its appeal due to the metal’s lack of yield.
From a market positioning standpoint, speculative interest in gold has weakened. Non-commercial traders reduced their net long positions to approximately 236.5K contracts as of November 12, the lowest level since early June, according to the latest CFTC positioning report. This reduction in long positions, coupled with a second consecutive decline in open interest, indicates a potential loss of momentum in gold’s recent upward trajectory.
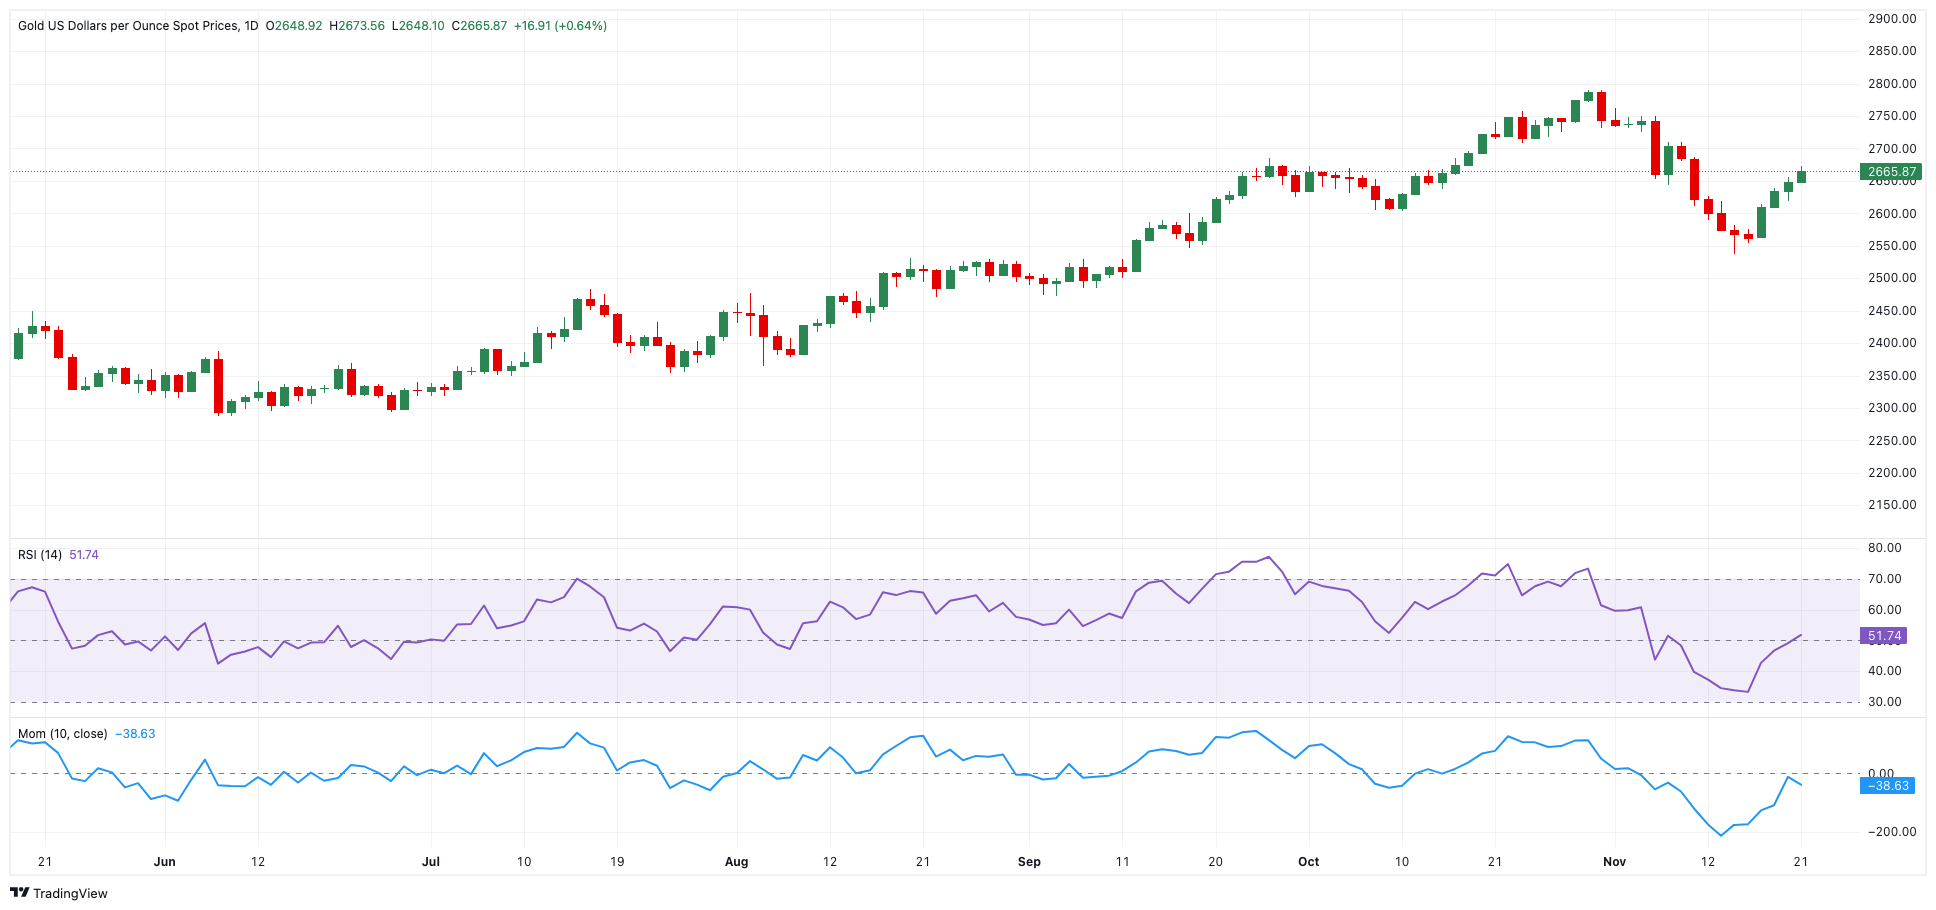
Gold daily chart
XAU/USD short-term technical outlook
The daily chart for XAU/USD shows a continuation of the recent breakout of the bullish 100-day Simple Moving Average (SMA) at $2,557, which is near the November low of $2,536. Moving higher, the current weekly peak at $2,673 (November 21) marks the first key resistance area. Beyond this, the next target is the $2,700 round level, followed by the weekly high of $2,749 (November 5).
On the downside, a swift break below the 100-day SMA could shift focus toward the November low of $2,536 (November 14), which serves as a decent support level.
In the short term, the 4-hour chart suggests further room for the current recovery to progress. The Relative Strength Index (RSI) has deflated to the sub-68 region, while the Average Directional Index (ADX) at nearly 40 is indicative that the current uptrend is gathering strength.
Looking upward, the next key resistance to watch is $2,673, followed by the critical 200-day SMA at $2,678. On the downside, the 55-SMA comes first at $2,613, ahead of $2,536.
Premium
You have reached your limit of 3 free articles for this month.
Start your subscription and get access to all our original articles.
Author

Pablo Piovano
FXStreet
Born and bred in Argentina, Pablo has been carrying on with his passion for FX markets and trading since his first college years.


