Gold Price Forecast: XAU/USD eyes a pullback before resuming journey toward $2,075
- Gold price is sitting at 13-month highs near $2,050 in a stunning week.
- Soft United States inflation data boosts Gold price at the expense of US Dollar.
- Gold price is likely to retreat from the rising wedge resistance amid overbought RSI on the 4H chart.

Gold price is consolidating near the highest level in thirteen months at mid-$2,000 early Friday, as bulls take a breather after a three-day winning streak. The United States Dollar (USD) remains vulnerable near yearly lows ahead of the US Retail Sales and Consumer Sentiment data.
United States Consumer-centric data holds the key
After cooling inflation data from the United States, markets await the US Consumer-centric data for the next move lower in the US Dollar. The revival of the dovish Federal Reserve interest rates outlook smashed the US Dollar to a one-year low against a basket of currencies on Thursday, with the US Dollar Index staying vulnerable on the 100.00 level.
On Thursday, US Producer Price Index (PPI) continued its downward slide in March, with annualized price increases sinking dramatically to 2.7% from an upwardly revised 4.9%. It was the lowest annual level for the key inflation gauge since January 2021. Signs of softening price pressures broadly continued to accentuate the downside in the US Dollar.
Earlier this week, the US Consumer Price Index data showed an annual increase in the inflation rate by 5.0%, while the month-on-month CPI rise was 0.1% in March. The all-items index increased 5.0% for the 12 months ending March, registering the smallest 12-month increase since the period ending May 2021. In the face of softening inflation in the United States, markets are now convinced that the Fed could pause its tightening cycle in June and deliver rate cuts before the end of the year.
The non-interest-bearing Gold price, therefore, surged beyond the $2,030 hurdle to challenge the $2,050 barrier. The next move in the Gold price will be dependent on the US Dollar price action on the release of the US Retail Sales and Consumer Sentiment data due later in the North American session. The US Retail Sales are seen falling by 0.4% in March on a monthly basis while the Core Retail Sales are seen lower by 0.3% MoM in the reported period. The University of Michigan's Preliminary Consumer Sentiment data is expected to hold steady at 62.0 in April. The 5-year Consumer Inflation Expectations will be also reported alongside, and could likely have a strong bearing on the Fed expectations.
Gold price technical analysis: Four-hour chart
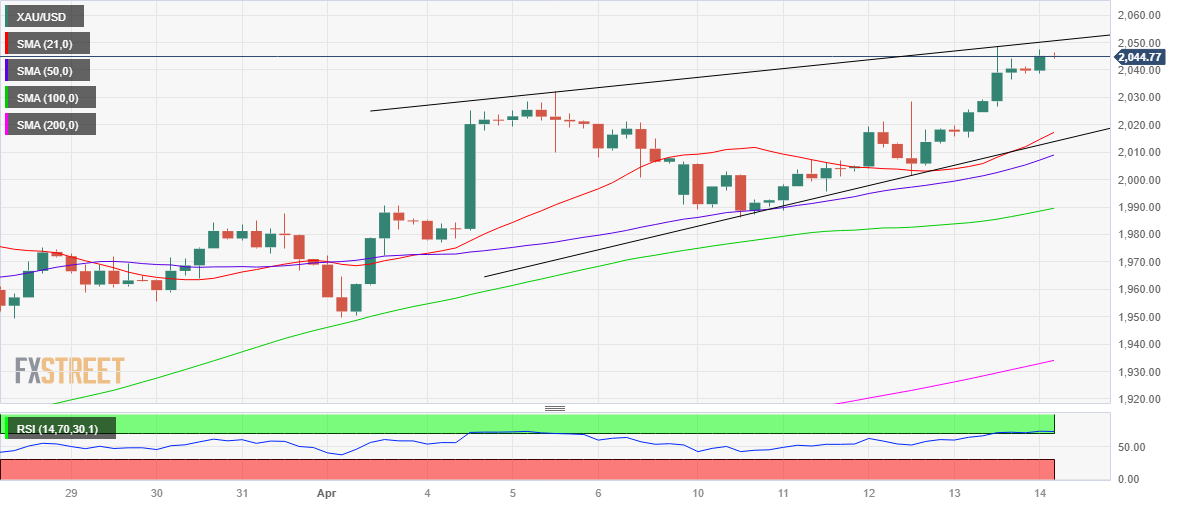
As observed on the four-hour chart, Gold price has approached the upper boundary of the rising wedge formation, at $2,050.
Meanwhile, the Relative Strength Index (RSI) is holding within the overbought territory, suggesting that a corrective pullback could be in the offing.
Any retracement from higher levels could test the previous yearly high at $2,032, below which the strong support at $2,017 will challenge bullish commitments.
On the flip side, should Gold bulls yield a four-hourly candlestick closing above the wedge resistance at $2,050, then a fresh upswing could be initiated toward the March 2022 high of 2,070.
Gold buyers will then aim for record highs at $2,075.
All in all, gold price remains a ‘buy-the-dips’ trade in the coming days.
Premium
You have reached your limit of 3 free articles for this month.
Start your subscription and get access to all our original articles.
Author

Dhwani Mehta
FXStreet
Residing in Mumbai (India), Dhwani is a Senior Analyst and Manager of the Asian session at FXStreet. She has over 10 years of experience in analyzing and covering the global financial markets, with specialization in Forex and commodities markets.