Gold Price Forecast: XAU/USD extends consolidative phase around $2,030

XAU/USD Current price: 2,029.15
- Wall Street trades with a positive tone, shrugs off the sour tone of its overseas counterparts.
- The United States Consumer Price Index will likely take markets out of their lethargy.
- XAU/USD holds within familiar levels, risk skews to the downside.
Gold trades within familiar levels on Wednesday, with a scarce macroeconomic calendar and upcoming first-tier events maintaining investors in cautious mode. Wall Street opened with a positive tone and holds on to modest gains, partially reverting its latest losses but also trading uneventfully.
XAU/USD bottomed at $2,016.61 on Monday, falling from an early high of $2,046.55 and holding within such an area ever since. The lethargy is set to end on Thursday, when the United States (US) will release the December Consumer Price Index (CPI). The index is expected to post an annualized increase of 3.2%, slightly above the previous 3.1%. The core reading, however, is seen shrinking to 3.8% from 4% in November.
Market participants are betting the US Federal Reserve (Fed) could start cutting rates as soon as next March. Indeed, easing inflationary pressures will confirm such an idea, regardless of the latest data showing the tight labour market. The CPI readings will likely impact sentiment, with the US Dollar then trading accordingly.
XAU/USD short-term technical outlook
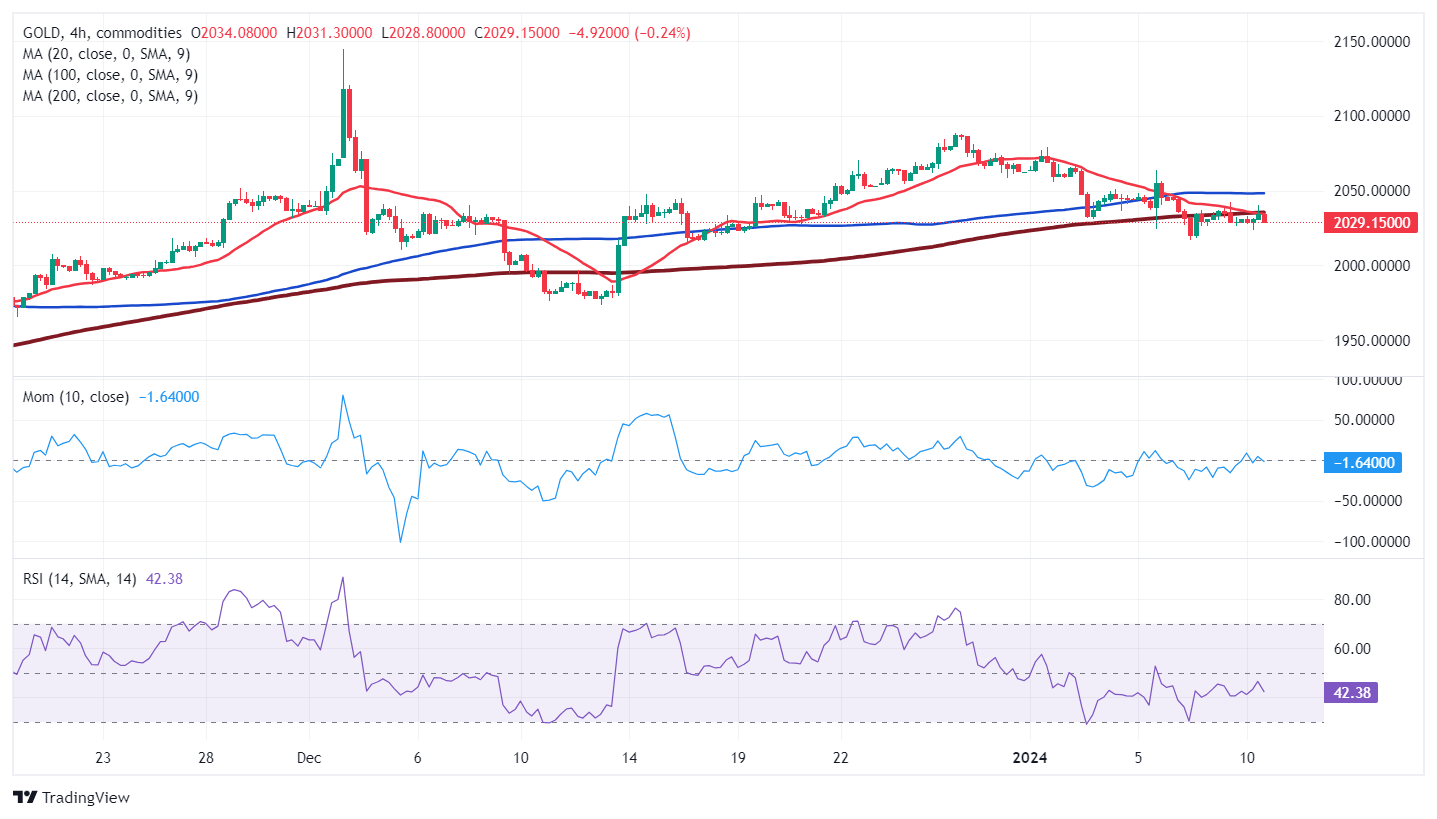
The daily chart for XAU/USD reflects the lack of directional strength. The bright metal develops below a mildly bullish 20 Simple Moving Average (SMA), which provides dynamic resistance at around $2,040.30. Meanwhile, a modestly bullish 100 SMA crosses a flat 200 SMA, both in the $1,960 price zone. Finally, technical indicators edge marginally lower within neutral levels, not enough to confirm another leg south.
The near-term picture skews the risk to the downside as the XAU/USD pair develops below all its moving averages. Furthermore, a bearish 20 SMA is crossing below the 200 SMA, while the 100 SMA remains directionless above them. At the same time, the Momentum indicator hovers around its 100 line, while the Relative Strength Index (RSI) indicator gains downward traction within negative levels, supporting another leg south towards the weekly low at $2,016.61.
Support levels: 2,016.60 1,998.65 1,987.20
Resistance levels: 2,040.30 2,052.30 2,065.45
Premium
You have reached your limit of 3 free articles for this month.
Start your subscription and get access to all our original articles.
Author

Valeria Bednarik
FXStreet
Valeria Bednarik was born and lives in Buenos Aires, Argentina. Her passion for math and numbers pushed her into studying economics in her younger years.


