Gold Price Forecast: XAU/USD corrective advance continues despite US Dollar strength

XAU/USD Current price: $1,897.93
- Speculative interest is closely following government bond yields’ behavior.
- Wall Street retains its positive tone amid strength in the tech sector.
- XAU/USD holds on to modest gains, corrective advance can continue.
XAU/USD rallied early on Tuesday, reaching an intraday high of $1,904.44 during London trading hours. It quickly changed course as the US Dollar found demand following news that S&P Global Ratings downgraded ratings for several United States (US) banks, following a similar move from Moody’s Investors Service last week.
Wall Street trimmed part of its pre-opening gains, while European indexes also eased from their intraday highs but retained the green. US indexes rallied on Monday amid strength in the tech sector, leading to substantial gains in the Nasdaq Composite and the S&P 500. At the time being, equities retain their bullish bias, pushing XAU/USD up from an intraday low of $1,889.12.
The USD is also being affected by government bond yields. The 10-year Treasury note reached multi-year highs on Monday, only to surpass them on Tuesday, hitting 4.366%. It currently hovers around 4.32%, while the 2-year note offers 5.01%, not far from an intraday high of 5.04%.
Market participants show signs of stress before the annual Jackson Hole Symposium featuring words from major central banks’ leaders. US Federal Reserve (Fed) Chair Jerome Powell and European Central Bank (ECB) President Christine Lagarde will speak on Friday.
XAU/USD price short-term technical outlook
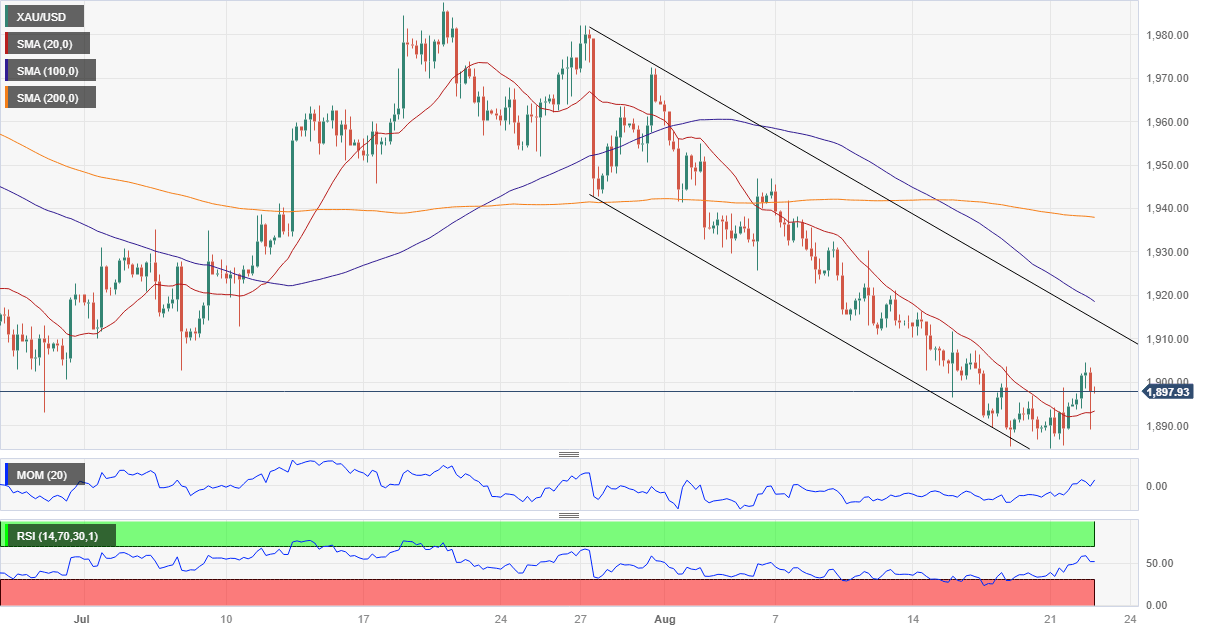
The XAU/USD pair preserves modest gains for a second consecutive day while posting a higher high and a higher low, in line with the ongoing corrective advance. Nevertheless, a steeper recovery is out of the picture at the time being. In the daily chart, Gold develops below all its moving averages, with the 20 Simple Moving Average (SMA) extending its slide above the 200 SMA, the latter a few cents above the aforementioned intraday high. Technical indicators, in the meantime, advance within negative levels with limited strength. Furthermore, the Relative Strength Index (RSI) indicator remains near oversold readings, suggesting tepid buying interest.
In the near term, and according to the 4-hour chart, XAU/USD is neutral. Technical indicators seesaw around their midlines, now heading higher although below their intraday highs. The chart shows that the pair briefly pierced a directionless 20 SMA but currently develops above it. Still, the longer moving averages maintain their bearish slopes far above the current levels.
Support levels: 1,884.20 1,871.50 1,859.90
Resistance levels: 1,903.60 1,915.30 1,922.40
Premium
You have reached your limit of 3 free articles for this month.
Start your subscription and get access to all our original articles.
Author

Valeria Bednarik
FXStreet
Valeria Bednarik was born and lives in Buenos Aires, Argentina. Her passion for math and numbers pushed her into studying economics in her younger years.


