XAU/USD Current price: $2,582.67
- Investors await the Federal Reserve announcement and the first rate cut in four years.
- Treasury bond yields fell towards fresh yearly lows, weighing on the US Dollar.
- XAU/USD retreated modestly from record highs, retains its bullish potential.
Gold price reached a fresh record high of $2,589.50 a troy ounce on Monday, retreating just modestly from the level and now trading at around $2,582.00 in the American session. XAU/USD surged during Asian trading hours, helped by a resurgent Japanese Yen (JPY), which put pressure on the US Dollar against all major rivals.
The USD/JPY pair fell to its lowest in over a year as investors keep an eye on the interest rate difference between the United States (US) and Japan, as both central banks are meant to announce their monetary policies this week. The Federal Reserve (Fed) is widely anticipated to cut the benchmark interest rate by 25 basis points (bps) on Wednesday, while the Bank of Japan (BoJ) will likely move in the opposite direction on Friday. The US Dollar also fell in anticipation of the Fed’s announcement, as there is a chance the central bank will go for a larger rate cut.
Meanwhile, US Treasury yields trade near fresh multi-month lows. The 10-year note currently offers 3.63%, while the 2-year note yields 3.55%, its lowest in two years.
XAU/USD short-term technical outlook
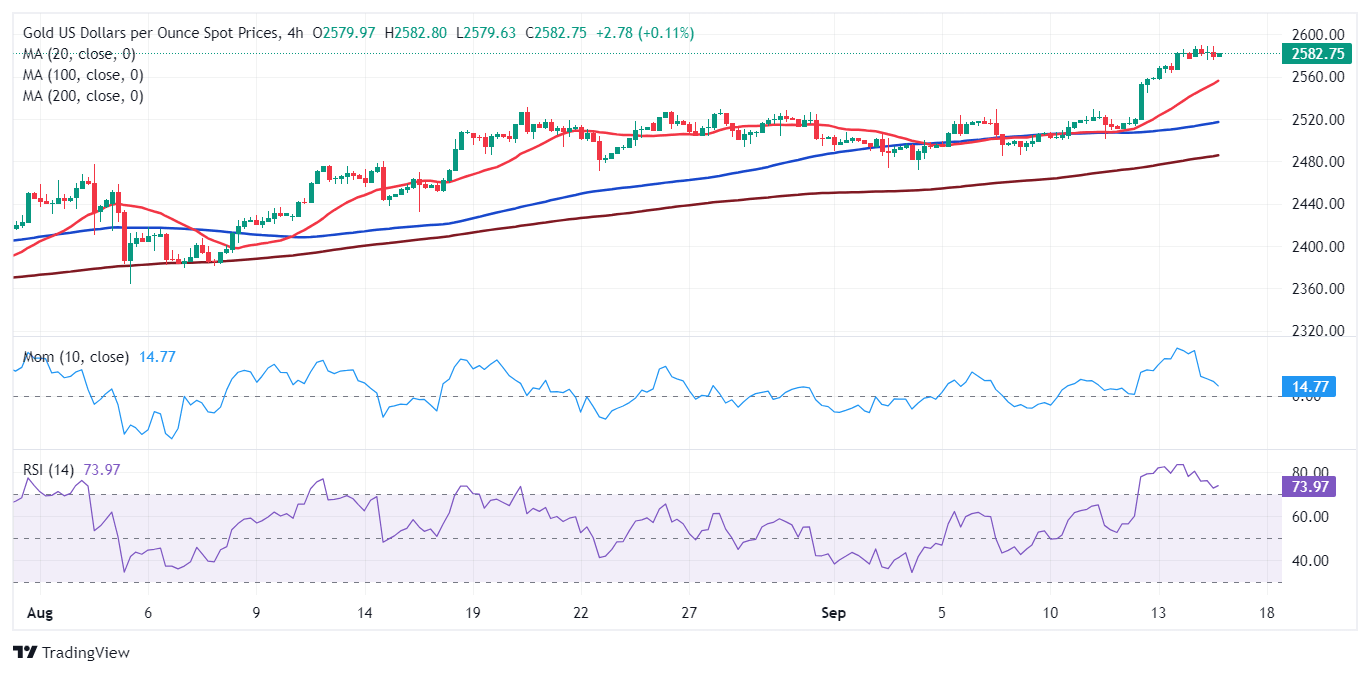
The XAU/USD pair holds on to modest intraday gains, and technical readings in the daily chart show the risk skews to the upside, although the momentum receded. The pair finally detached from a bullish 20 Simple Moving Average (SMA), currently at around $2,517. The 100 and 100 SMAs gain upward traction far below the shorter one, reflecting persistent buying interest. Finally, technical indicators have turned flat, although they hold well into positive territory.
In the near term, and according to the 4-hour chart, XAU/USD seems poised to correct overbought conditions. Technical indicators are retreating from extreme levels with modest downward slopes, not enough to anticipate a steeper decline. Meanwhile, a firmly bullish 20 SMA heads firmly higher in the $2,550 region, far above the longer ones, which also advance.
Support levels: 2,575.20 2,563.60 2,550.00
Resistance levels: 2,590.00 2,605.00 2,620.00
Information on these pages contains forward-looking statements that involve risks and uncertainties. Markets and instruments profiled on this page are for informational purposes only and should not in any way come across as a recommendation to buy or sell in these assets. You should do your own thorough research before making any investment decisions. FXStreet does not in any way guarantee that this information is free from mistakes, errors, or material misstatements. It also does not guarantee that this information is of a timely nature. Investing in Open Markets involves a great deal of risk, including the loss of all or a portion of your investment, as well as emotional distress. All risks, losses and costs associated with investing, including total loss of principal, are your responsibility. The views and opinions expressed in this article are those of the authors and do not necessarily reflect the official policy or position of FXStreet nor its advertisers. The author will not be held responsible for information that is found at the end of links posted on this page.
If not otherwise explicitly mentioned in the body of the article, at the time of writing, the author has no position in any stock mentioned in this article and no business relationship with any company mentioned. The author has not received compensation for writing this article, other than from FXStreet.
FXStreet and the author do not provide personalized recommendations. The author makes no representations as to the accuracy, completeness, or suitability of this information. FXStreet and the author will not be liable for any errors, omissions or any losses, injuries or damages arising from this information and its display or use. Errors and omissions excepted.
The author and FXStreet are not registered investment advisors and nothing in this article is intended to be investment advice.
Recommended Content
Editors’ Picks

Gold trades near record-high, stays within a touching distance of $3,100
Gold clings to daily gains and trades near the record-high it set above $3,080 earlier in the day. Although the data from the US showed that core PCE inflation rose at a stronger pace than expected in February, it failed to boost the USD.

EUR/USD turns positive above 1.0800
The loss of momentum in the US Dollar allows some recovery in the risk-associated universe on Friday, encouraging EUR/USD to regain the 1.0800 barrier and beyond, or daily tops.

GBP/USD picks up pace and retests 1.2960
GBP/USD now capitalises on the Greenback's knee-jerk and advances to the area of daily peaks in the 1.2960-1.2970 band, helped at the same time by auspicious results from UK Retail Sales.

Donald Trump’s tariff policies set to increase market uncertainty and risk-off sentiment
US President Donald Trump’s tariff policies are expected to escalate market uncertainty and risk-off sentiment, with the Kobeissi Letter’s post on X this week cautioning that while markets may view the April 2 tariffs as the "end of uncertainty," it anticipates increased volatility.

US: Trump's 'Liberation day' – What to expect?
Trump has so far enacted tariff changes that have lifted the trade-weighted average tariff rate on all US imports by around 5.5-6.0%-points. While re-rerouting of trade will decrease the effectiveness of tariffs over time, the current level is already close to the highest since the second world war.

The Best brokers to trade EUR/USD
SPONSORED Discover the top brokers for trading EUR/USD in 2025. Our list features brokers with competitive spreads, fast execution, and powerful platforms. Whether you're a beginner or an expert, find the right partner to navigate the dynamic Forex market.