- Gold price looks to extend the rebound early Thursday, focus shifts to US Nonfarm Payrolls.
- US Dollar drops with US Treasury bond yields on non-committal Fed policy stance.
- Gold price remains a ‘buy on dips’ trade amid multiple Bull Cross confirmations.
Gold price is finding its feet to attempt another run to the $2,000 threshold early Thursday, as the United States Dollar (USD) and US Treasury bond yields lick their wounds following a non-committal US Federal Reserve (Fed) interest rate outlook and mixed US economic data.
Gold price cheers less hawkish Fed, US Treasury announcement
Gold price enjoyed a good two-way price movement on Wednesday, advancing toward the $2,000 mark ahead of the Fed policy announcements, as the US Dollar stalled its recovery mode amid sluggish US Treasury bond yields and a mixed market mood. However, Gold price changed course and tested the $1,970 round figure, in a knee-jerk reaction to the Fed’s policy inaction, as widely expected. The US Federal Reserve left the key policy rate unchanged in its current 5.25%-5.50% range.
It was Fed Chair Jerome Powell’s press conference and his response to the questions that smashed the US Dollar alongside the US Treasury bond yields, triggering an impressive comeback in Gold price. Although Powell did not rule out another hike, markets perceived his words as not quite as hawkish as they expected. He acknowledged tighter financial conditions, a strong labor market, a resilient economy and an elevated inflation level.
The sell-off in the US Treasury bond yields was also in part due to a quarterly Treasury announcement that said the government will slow increases in the size of its longer-dated auctions. The auction of 10-year Treasuries was increased by $2 billion, below the market's expectations of $3 billion. The benchmark 10-year Treasury bond yield tumbled over 20 basis points (bps) to 4.7089%, the lowest in more than two weeks.
Meanwhile, the US Dollar also faced headwinds from mixed economic data, with the US ADP private sector payrolls rising 113K in October, below the estimate of 130,000. US ISM Manufacturing PMI slumped to 46.7 in October vs. 49.0 expected. The Job Openings and Labor Turnover Summary (JOLTS) report showed that the number of job openings on the last business day of September stood at 9.55M, slightly up from a revised 9.50M in August and ahead of the 9.25M forecast.
In Thursday’s trading so far, Gold price is building on the previous recovery, as investors weigh the path forward on interest rate by the Fed, with bets for a December and January rate hike pared back and markets pricing in Fed rate cuts as early as June next year. The extension of the Fed-led risk rally on global stocks will likely keep the safe-haven US Dollar undermined, as traders look past the Hamas-Israel conflict in the lead-up to Friday’s US Nonfarm Payrolls data release.
Gold traders will also watch out for the Bank of England (BoE) monetary policy decision due later in the day, with the key rate likely to remain unchanged at 5.25% for the second straight meeting. A dovish BoE pause is likely to provide a fresh boost to stocks while sinking the Pound Sterling and alleviating some pressure off the US Dollar. However, upside risks remain well in place for Gold price, as justified by the daily technical setup.
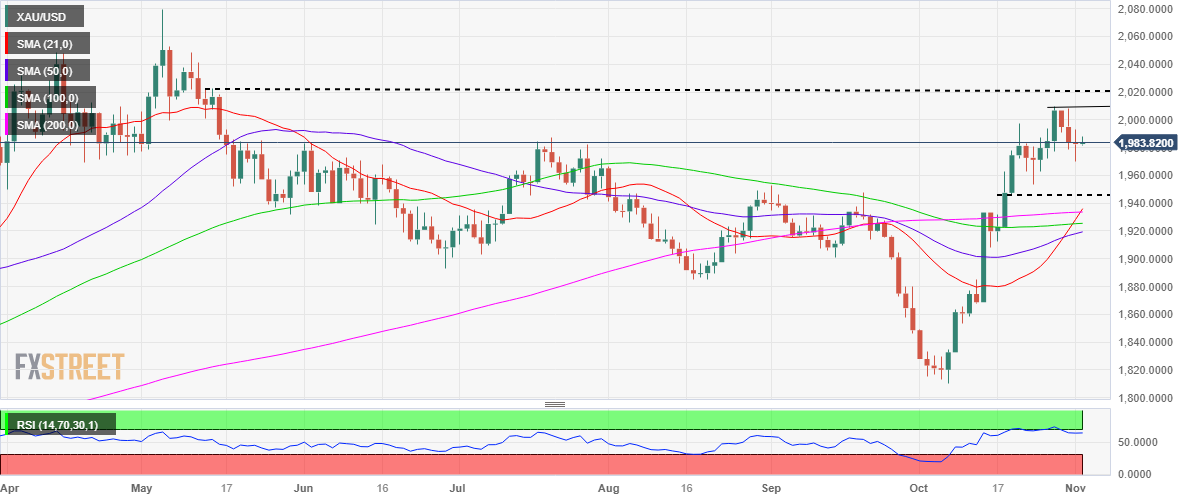
Gold price technical analysis: Daily chart
Traders continue to portray ‘buy the dips’ trading in Gold price, as long as the critical static support at $1,963 holds.
The 14-day Relative Strength Index (RSI) indicator remains well positioned to see a renewed uptick while above the midline.
Moreover, the 21- and 50-day Simple Moving Averages (SMA) Bull Cross remains in play alongside the 21- and 100-day SMAs Bull Cross, adding credence to the bullish potential.
Furthermore, the 21-day SMA awaits a daily closing above the 200-day SMA to validate another Bull Cross, opening doors for a sustained upside.
Immediate resistance is seen at the previous day’s high of $1,993, above which the $2,000 threshold will be retested.
Acceptance above the multi-month high of $2,009 is critical to reviving the uptrend toward the mid-May high near $2,020.
On the downside, a failure to resist the powerful support at $1,963, will fuel a fresh drop to the $1,950 psychological level.
A deeper decline will put the October 19 low of $1,945 to the test.
Information on these pages contains forward-looking statements that involve risks and uncertainties. Markets and instruments profiled on this page are for informational purposes only and should not in any way come across as a recommendation to buy or sell in these assets. You should do your own thorough research before making any investment decisions. FXStreet does not in any way guarantee that this information is free from mistakes, errors, or material misstatements. It also does not guarantee that this information is of a timely nature. Investing in Open Markets involves a great deal of risk, including the loss of all or a portion of your investment, as well as emotional distress. All risks, losses and costs associated with investing, including total loss of principal, are your responsibility. The views and opinions expressed in this article are those of the authors and do not necessarily reflect the official policy or position of FXStreet nor its advertisers. The author will not be held responsible for information that is found at the end of links posted on this page.
If not otherwise explicitly mentioned in the body of the article, at the time of writing, the author has no position in any stock mentioned in this article and no business relationship with any company mentioned. The author has not received compensation for writing this article, other than from FXStreet.
FXStreet and the author do not provide personalized recommendations. The author makes no representations as to the accuracy, completeness, or suitability of this information. FXStreet and the author will not be liable for any errors, omissions or any losses, injuries or damages arising from this information and its display or use. Errors and omissions excepted.
The author and FXStreet are not registered investment advisors and nothing in this article is intended to be investment advice.
Recommended Content
Editors’ Picks

EUR/USD clings to strong daily gains near 1.0400
EUR/USD remains on track to post strong gains despite retreating from the session high it set above 1.0430. The positive shift in risk mood, as reflected by the bullish action seen in Wall Street, forces the US Dollar to stay on the back foot and helps the pair hold its ground.

GBP/USD surges above 1.2500 as risk flows dominate
GBP/USD extends its recovery from the multi-month low it set in the previous week and trades above 1.2500. The improving market sentiment on easing concerns over Trump tariffs fuelling inflation makes it difficult for the US Dollar (USD) to find demand and allows the pair to stretch higher.

Gold firmer above $2,630
Gold benefits from the broad-based US Dollar weakness and recovers above $2,630 after falling to a daily low below $2,620 in the early American session on Monday. Meanwhile, the benchmark 10-year US Treasury bond yield holds above 4.6%, limiting XAU/USD upside.

Bitcoin Price Forecast: Reclaims the $99K mark
Bitcoin (BTC) trades in green at around $99,200 on Monday after recovering almost 5% in the previous week. A 10xResearch report suggests BTC could approach its all-time high (ATH) of $108,353 ahead of Trump’s inauguration.

Five fundamentals for the week: Nonfarm Payrolls to keep traders on edge in first full week of 2025 Premium
Did the US economy enjoy a strong finish to 2024? That is the question in the first full week of trading in 2025. The all-important NFP stand out, but a look at the Federal Reserve and the Chinese economy is also of interest.

Best Forex Brokers with Low Spreads
VERIFIED Low spreads are crucial for reducing trading costs. Explore top Forex brokers offering competitive spreads and high leverage. Compare options for EUR/USD, GBP/USD, USD/JPY, and Gold.
