- Gold holds steady amid quiet markets, sitting at weekly highs.
- US Treasury yields decline offseting the rebound in the greenback.
- Gold yearns for acceptance above December highs amid bullish technical setup.
Gold price remained stuck within an extremely tight range above $1,800 on Christmas Eve, as most traders were out celebrating the festive season in the US and Europe. US Treasury markets were closed on Friday but the upside in gold price remained capped by the previous recovery rally in Treasury yields, with the 10-year having recaptured the 1.50% level. Gold price managed to find support from an across the board profit-taking slide in the US dollar as year-end flows and thin liquidity played out. Markets also remained wary amid surging Omicron cases in the UK and Europe which kept them away from placing any directional bets on gold price heading into the extended Xmas weekend.
During this Monday’s trading so far, nothing seems to have changed for gold price as it maintains its range play at almost one-week highs of $1,812. The renewed downside in Treasury yields offset broad strength in the US dollar, keeping the buoyant tone intact for gold price. 10-year yields have slipped back below the 1.50% level, currently trading at 1.48%. Investors continue weighing in the impact of the Omicron covid variant-induced restrictions on the economic recovery worldwide while being cautious amidst year-end positions’ adjustments and US fiscal spending hopes. Gold price could face the risk of wild moves given that thin liquidity will persist all through this week.
Gold Price Chart - Technical outlook
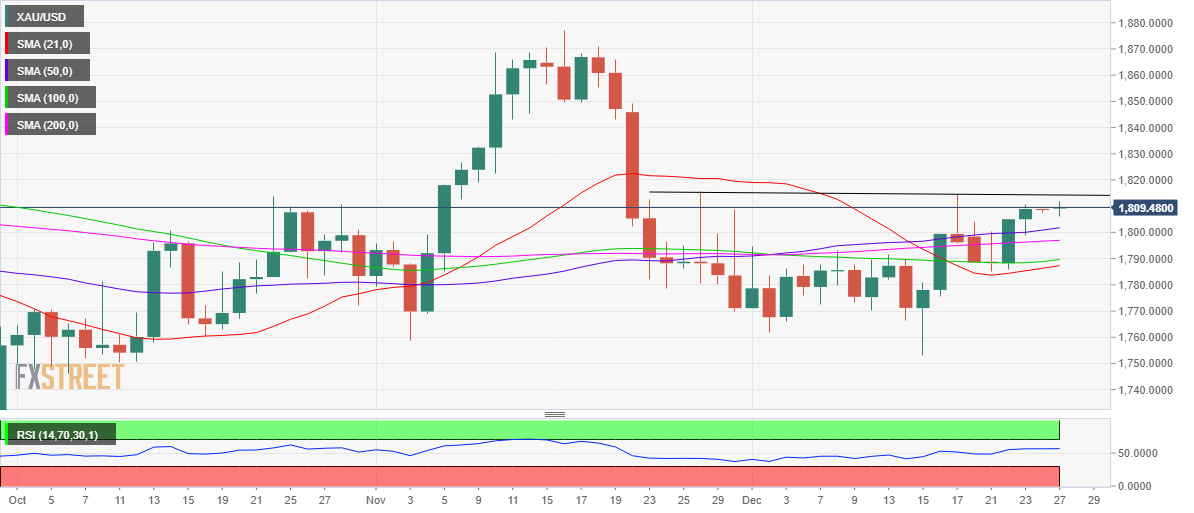
Gold: Daily chart
Sustaining above all the major Daily Moving Averages (DMA) is boding well for the bright metal at the start of a new week.
The 14-day Relative Strength Index (RSI) is trading flat but well above 50.00, suggesting that the bullish bias remains intact.
Gold bulls need to clear the December highs of $1,814 on a daily closing basis to extend the previous week’s rebound. The next critical target for bulls is pegged at the $1,820 round number.
Alternatively, the mildly bullish 50-DMA at $1,802 could limit any immediate downside move, below which the 200-DMA of $1,797 will be put to test. The 100-DMA at $1,790 is likely to challenge bullish commitments should bearish momentum accelerate.
Information on these pages contains forward-looking statements that involve risks and uncertainties. Markets and instruments profiled on this page are for informational purposes only and should not in any way come across as a recommendation to buy or sell in these assets. You should do your own thorough research before making any investment decisions. FXStreet does not in any way guarantee that this information is free from mistakes, errors, or material misstatements. It also does not guarantee that this information is of a timely nature. Investing in Open Markets involves a great deal of risk, including the loss of all or a portion of your investment, as well as emotional distress. All risks, losses and costs associated with investing, including total loss of principal, are your responsibility. The views and opinions expressed in this article are those of the authors and do not necessarily reflect the official policy or position of FXStreet nor its advertisers. The author will not be held responsible for information that is found at the end of links posted on this page.
If not otherwise explicitly mentioned in the body of the article, at the time of writing, the author has no position in any stock mentioned in this article and no business relationship with any company mentioned. The author has not received compensation for writing this article, other than from FXStreet.
FXStreet and the author do not provide personalized recommendations. The author makes no representations as to the accuracy, completeness, or suitability of this information. FXStreet and the author will not be liable for any errors, omissions or any losses, injuries or damages arising from this information and its display or use. Errors and omissions excepted.
The author and FXStreet are not registered investment advisors and nothing in this article is intended to be investment advice.
Recommended Content
Editors’ Picks

EUR/USD holds above 1.0400 in quiet trading
EUR/USD trades in positive territory above 1.0400 in the American session on Friday. The absence of fundamental drivers and thin trading conditions on the holiday-shortened week make it difficult for the pair to gather directional momentum.

GBP/USD recovers above 1.2550 following earlier decline
GBP/USD regains its traction and trades above 1.2550 after declining toward 1.2500 earlier in the day. Nevertheless, the cautious market mood limits the pair's upside as trading volumes remain low following the Christmas break.

Gold declines below $2,620, erases weekly gains
Gold edges lower in the second half of the day and trades below $2,620, looking to end the week marginally lower. Although the cautious market mood helps XAU/USD hold its ground, growing expectations for a less-dovish Fed policy outlook caps the pair's upside.

Bitcoin misses Santa rally even as on-chain metrics show signs of price recovery
Bitcoin (BTC) price hovers around $97,000 on Friday, erasing most of the gains from earlier this week, as the largest cryptocurrency missed the so-called Santa Claus rally, the increase in prices prior to and immediately following Christmas Day.

2025 outlook: What is next for developed economies and currencies?
As the door closes in 2024, and while the year feels like it has passed in the blink of an eye, a lot has happened. If I had to summarise it all in four words, it would be: ‘a year of surprises’.

Best Forex Brokers with Low Spreads
VERIFIED Low spreads are crucial for reducing trading costs. Explore top Forex brokers offering competitive spreads and high leverage. Compare options for EUR/USD, GBP/USD, USD/JPY, and Gold.
