Gold Price Forecast: Why XAU/USD looks vulnerable below $1750? US ADP in focus
- Gold price keeps the red, as Treasury yields drive the US dollar higher ahead of ADP.
- Surging energy cost, Fed’s tapering calls and China worries weigh on risk appetite.
- Gold price needs acceptance below $1748 to seek additional downside.

Gold price retreated sharply from eight-day highs of $1771 and tested the recent range lows just below $1750 on Tuesday, before recovering to settle the day at $1760. The downside opened up in gold price, as the US dollar firmed amid the buying resurgence in the Treasury yields and the risk-off market profile.
Surging energy costs and US political infighting on the debt ceiling were the key reasons behind the reduced appetite for riskier assets, which boosted the US dollar’s safe-haven appeal. On the other side, rising inflation led by firmer commodity prices posed a threat to the economic recovery while advocating sooner than expected Fed’s monetary policy normalization. Growing Fed’s tapering bets drove Treasury yields higher, in turn, supporting the buck at gold’s expense. Gold is a non-interest-bearing investment asset.
Wednesday’s trading so far is no different for gold price, as bears remain in control, extending the previous declines amid the downbeat market mood. The US dollar looks to extend the renewed upside while Treasury yields keep pushing higher, weighing negatively on the yieldless gold price. Markets also turn cautious ahead of the US ADP Employment Change numbers, especially after stronger US ISM Services PMI, as it could seal in Fed’s tapering as early as next month. The US private sector is likely to have added 428K jobs in September vs. 374K previous. This indicator is widely watched, as it is a precursor to the all-important US NFP numbers.
However, US-China trade jitters, China Evergrande’s debt crisis and a stalemate over the American debt ceiling could keep the overall market sentiment undermined, which may put a floor under gold price, in the wake of a flight to safety.
Gold Price Chart - Technical outlook
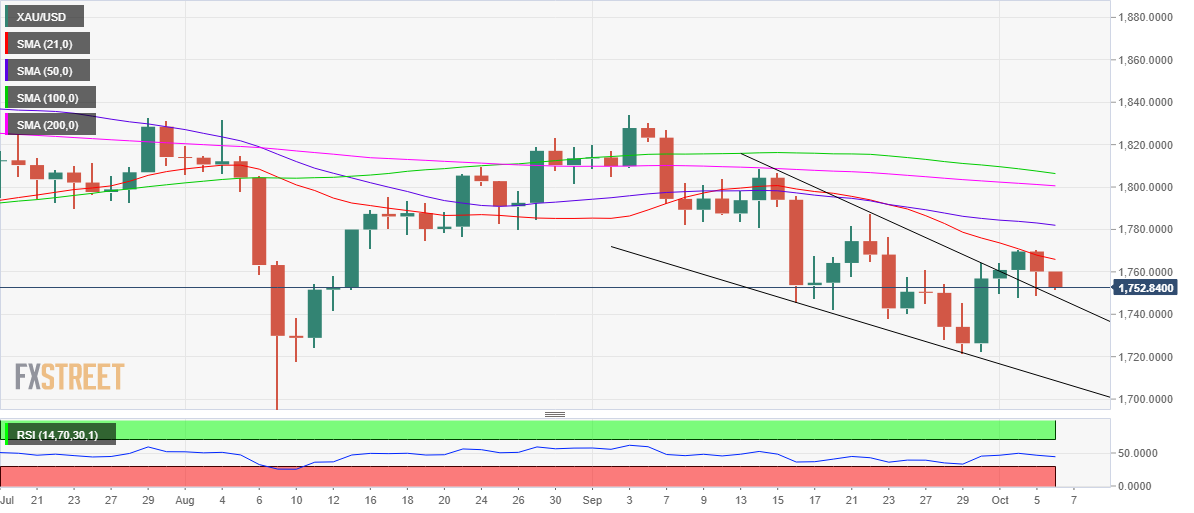
Gold: Daily chart
Gold’s daily chart shows that gold price broke out of the month-long falling wedge on Friday, although the bulls failed to extend the upside.
The bearish 21-Daily Moving Average (DMA), now at 1.1767 continues to remain a tough nut to crack for gold buyers.
The Relative Strength Index (RSI) is pointing lower while below the midline, backing the case for additional downside.
The September 27 highs of $1745 remain on the sellers’ radars if the recent range lows near the $1749 region is cleared on a sustained basis. Further south, the seven-week lows at $1722 could be back in play.
Only a daily closing above the short-term critical 21-DMA could revive the recent recovery momentum, opening gates towards the downward-sloping 50-DMA at $1782. Gold bulls will then target the $1800 psychological magnate.
Premium
You have reached your limit of 3 free articles for this month.
Start your subscription and get access to all our original articles.
Author

Dhwani Mehta
FXStreet
Residing in Mumbai (India), Dhwani is a Senior Analyst and Manager of the Asian session at FXStreet. She has over 10 years of experience in analyzing and covering the global financial markets, with specialization in Forex and commodities markets.


