Gold Price Forecast: Risks appear skewed to the downside for XAU/USD, US inflation in focus
- Gold price remains pressured amid firmer US dollar amid cautious optimism.
- ECB decision, US CPI to highlight policymaker’s thinking about monetary stimulus.
- Gold’s four-hour chart paints a bearish picture heading into the key event risks.

Gold price (XAU/USD) fell for the second straight day on Wednesday, as a global sell-off ensued on increased nervousness ahead of Thursday’s European Central Bank (ECB) monetary policy decision and US Consumer Price Index (CPI) data. The risk-off market mood dragged the Treasury yields lower, although helped lift the US dollar across the board at gold’s expense. Escalating US-China tensions over an alleged Beijing’s tech threat and uncertainty over President Joe Biden’s infrastructure stimulus plans also weighed on the investor’s sentiment. However, the dollar’s strength remained the key catalyst behind the decline in gold price.
Gold price is extending the previous decline, undermined by the dollar’s demand. The greenback holds the higher ground, despite the market optimism, as investors resort to repositioning ahead of the all-important ECB announcement and US inflation release. These key events will shed light on the pace of global recovery and policymakers’ thinking about paring back stimulus. If the US CPI print comes in hotter than the consensus of a 0.4% rise in May, it will ramp up the Fed’s tapering expectation, which will render negative for the non-yielding gold. The ECB could also hint towards dialling back of the emergency bond-buying programme.
Gold Price Chart - Technical outlook
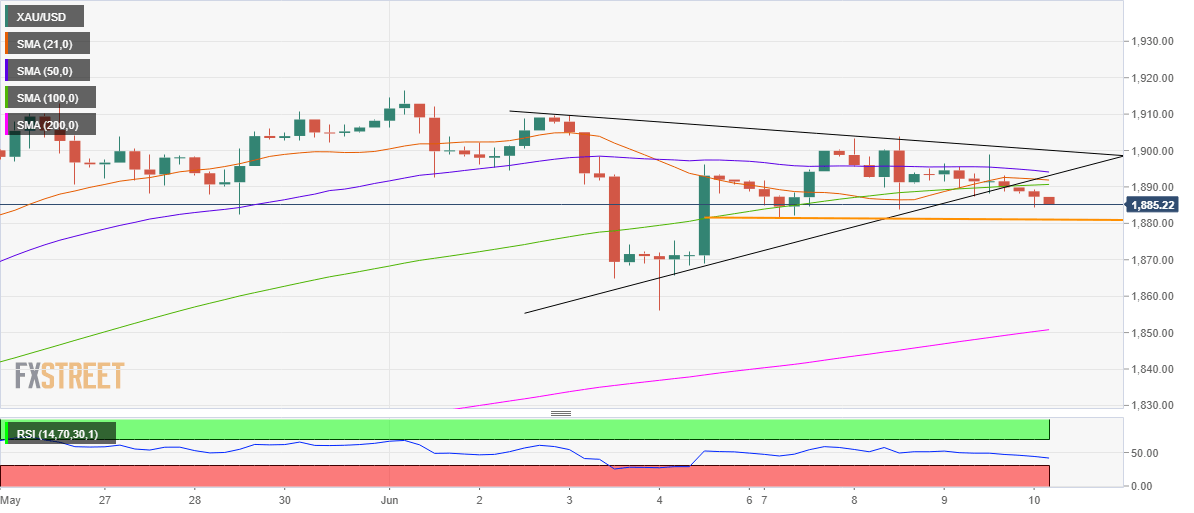
Gold: Four-hour chart
Gold’s four-hour chart paints a bearish picture, as the price has confirmed a symmetrical triangle breakdown in the US last session.
The Relative Strength Index (RSI) points south below the midline, allowing room for more declines.
Therefore, sellers could target the immediate support at the horizontal (orange) trendline connecting previous lows at $1881.
A breach of the latter could trigger a drop towards the June 4 low of $1856. Ahead of that, a demand area around $1865 could offer some reprieve to the bulls.
Meanwhile, any recovery attempt could face stiff resistance around the $1891-$1895 region, where the 21, 50 and 100-simple moving averages (SMA) collide.
Further up, the triangle resistance at $1900 will challenge the bullish commitments. The previous month high at $1913 is the level to beat for the optimists.
Premium
You have reached your limit of 3 free articles for this month.
Start your subscription and get access to all our original articles.
Author

Dhwani Mehta
FXStreet
Residing in Mumbai (India), Dhwani is a Senior Analyst and Manager of the Asian session at FXStreet. She has over 10 years of experience in analyzing and covering the global financial markets, with specialization in Forex and commodities markets.


