Gold Price Forecast: Pressure mounts as headaches arise

XAUUSD Current price: $1,717.83
- The IMF cut its global growth forecast for this year to 2.9% from 3.6% previously.
- The European energy crisis further hurts the market´s dismal mood.
- XAUUSD lacks bearish momentum in the near term, but sellers are still in the driver’s seat.
Spot gold trades at the lower end of its weekly range, little changed on a daily basis. The metal hovers around $1,718 a troy ounce, ignored by speculative interest amid prevalent risk aversion.
Two factors exacerbated recession-related concerns on Tuesday. On the one hand, the International Monetary Fund (IMF) cut the global growth forecast once again this year, from 3.6% in their April review to 2.9%. The organism also warned that downside risks from overheated inflation and the Ukraine war could push the world economy to the edge of a global recession. The World Economic Outlook also showed that if Russia completely cut gas to Europe, a drop in the country’s oil export would slow growth further in 2023.
On the other hand, the Eurozone faces one of its biggest crises since its creation as the energy hurdles steepen. Russia has responded to European sanctions by reducing its natural gas provision through the Nord Stream 1 pipeline. After closing it for maintenance, Moscow resumed deliveries, although Germany estimates Gazprom is currently sending just 20% of the pre-Ukraine war levels.
Stock markets edged lower, with European indexes ending the day with modest gains but Wall Street posting substantial losses. In the meantime, the US yield curve is the most inverted in over 20 years, boosting concerns about an economic setback in the world’s largest economy.
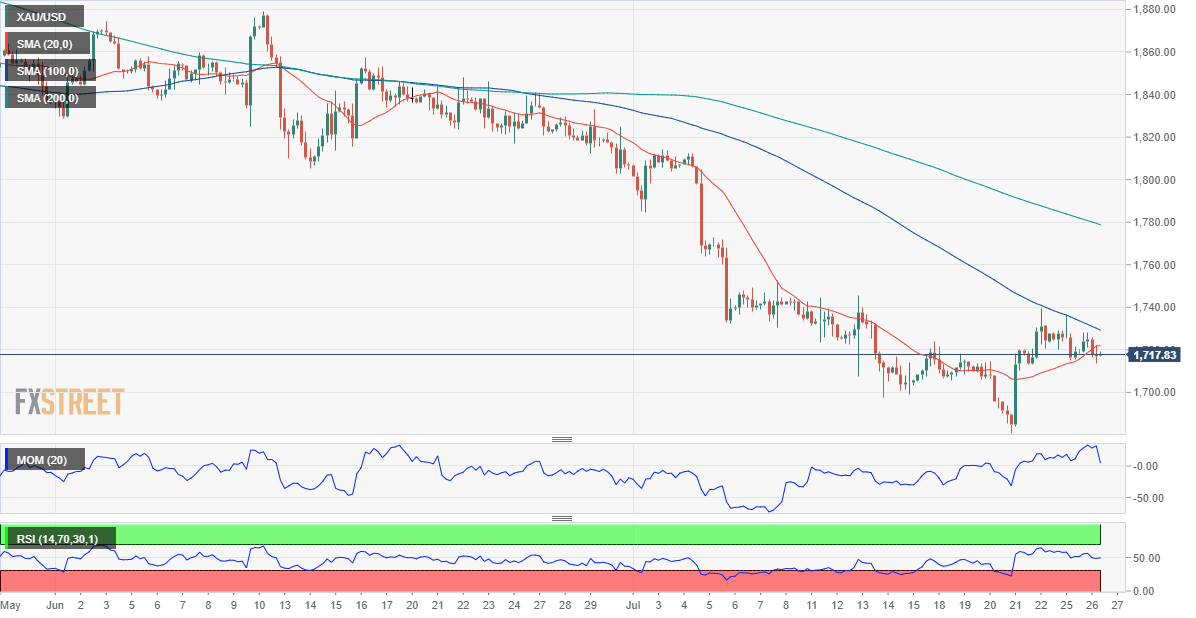
Gold price short-term technical outlook
XAUUSD has made little technical progress, according to the daily chart. It keeps developing below a firmly bearish 20 SMA, now providing dynamic resistance at around $1,742. The longer moving averages stand far above the shorter one, losing relevance at the time being. At the same time, the Momentum indicator advances within negative levels, while the RSI indicator stands directionless at around 36, both suggesting bears are still in the driver’s seat.
The near-term picture is neutral-to-bearish. The 4-hour chart shows that the pair has fallen below a mildly bullish 20 SMA and is also below a bearish 100 SMA. Technical indicators, in the meantime, turned marginally lower around their midlines, reflecting the absence of directional strength.
Support levels: 1.710.10 1,697.50 1,689.90
Resistance levels: 1,727.20 1,736.70 1,745.33
Premium
You have reached your limit of 3 free articles for this month.
Start your subscription and get access to all our original articles.
Author

Valeria Bednarik
FXStreet
Valeria Bednarik was born and lives in Buenos Aires, Argentina. Her passion for math and numbers pushed her into studying economics in her younger years.


