Gold Price Forecast: Logs biggest Weekly Gain Since February 2016, focus on coronavirus-related developments
- Gold is reporting biggest weekly rise in four years.
- Coronavirus-led risk-off and slide in US yields powered gains in the yellow metal.
- Bigger gains may be seen next week if risk aversion persists.
- Traders should take note of signs of bull exhaustion seen on the daily chart.

Gold is about to end the week with solid gains and could remain better bid over the next week if the virus fears continue to dominate the market sentiment.
The yellow metal is currently trading at $1,671 per Oz, representing a 5.4 percent gain from the weekly opening price of $1,585. That is the biggest weekly gain since February 2016.
The big gains could be associated with the Federal Reserve’s (Fed) emergency rate cut and the resulting slide in the US yields and the Dollar Index.
Fearing that the coronavirus fears would push the US economy into recession, the Fed moved out of its regular scheduled announcements for the first time since 2008 and delivered an emergency rate cut of 50 basis points on March 3.
The US 10-year yield fell by over 20 basis points on that day and hit a record low of 0.65% earlier Friday. At press time, the yield is trading at 0.746%, representing a 42.3 basis point drop on the week. Meanwhile, the Dollar Index is currently trading at 96.08 – down 2 percent on the week.
Notably, equities remained risk averse despite Fed’s rate cut, drawing haven bids for the yellow metal.
Risk sentiment eyed
“The week ahead will be short on impactful economic indicators – but likely still long on concerns about the ongoing escalation in the new coronavirus outbreak outside of China,” RBC Economists said in a weekly note.
Coronavirus pandemic is indeed showing no signs of slowing down. Further, markets are pricing in an additional 50 basis point rate cut for the March 18 meeting. So, there is a strong case to believe gold and other safe havens like the Japanese Yen, Swiss Franc and Euro would continue to gain altitude next week.
The risk aversion may worsen if China’s trade data for the month of February, due on March 7, prints well below estimates, bolstering fears of a deeper economic slowdown in the global economy.
The US Consumer Price Index for February is also scheduled for release on March 13. Traders, however, will likely ignore the inflation figure if the coronavirus continues to spread at a faster rate outside China.
Only a breakthrough in coronavirus research could bring about a positive shift in the broader market sentiment and weaken demand for the safe havens.
Technical outlook
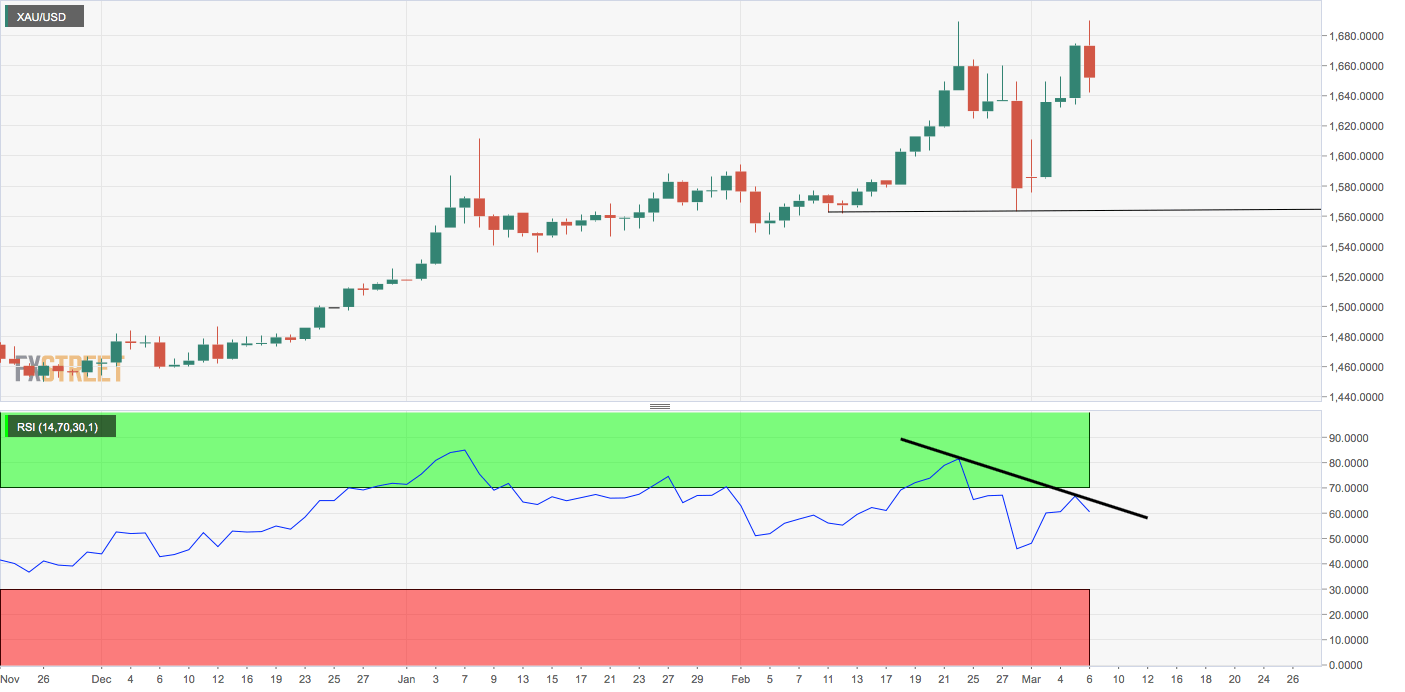
While the broader market sentiment favors further upside in gold, the daily technical chart is calling for caution on the part of the bulls.
Friday’s spinning top-like candle is signaling buyer exhaustion. That alongside, the bearish divergence of the 14-day relative strength index, suggests scope for a notable price pullback.
Also note that metal failed to take out $1,690 earlier today. That level proved a tough nut to crack on Feb. 24. Put simply, gold may be forming a double top with the neckline support at $1,563. Acceptance below that level would confirm a breakdown or bearish reversal.
On the higher side, a break above $1,690 would imply a continuation of the ongoing rally and shift the focus to $1,754 (November 2012 high).
Daily chart
Gold Forecast Poll
The Forex Forecast Poll is a sentiment tool that highlights near- and medium-term price expectations from leading market experts. As can be seen, the market expects the safe-haven metal to consolidate next week, but rise to levels above $1,680 by the end of the fourth week from now. However, prices are settling near $1,665 by the end of the three-month period.
Some correction could occur in the market, and the price for gold could decline to the lower boundary of the long-term ascending channel. if the given trend holds, it is likely that a reversal north could follow.
Author

Omkar Godbole
FXStreet Contributor
Omkar Godbole, editor and analyst, joined FXStreet after four years as a research analyst at several Indian brokerage companies.


