Gold Price Forecast: Eyes 8-month rising trendline after weakest weekly close since December

Gold has suffered its weakest weekly close in four months and appears on track to test the ascending trendline from August 2018 lows over the next week or two.
The yellow metal has ended this week at $1,275, the lowest weekly close since December, representing a 1.16 percent drop. Prices hit a low of $1,271 earlier this week.
The sell-off seems to have been triggered by the strength in the US dollar, gold’s biggest nemesis.
The dollar index, which tracks the value of the greenback against majors, is on track to end the week with 0.57 percent gains and could remain bid next week, as the data released yesterday showed the consumer spending ticked higher in March and will likely remain solid in the near future with jobless claims hitting 50-year low.
As a result, the path of least resistance for the safe haven yellow metal appears to be on the downside. Validating that argument is the weekly chart, which indicates scope for a slide to key rising trendline support.
Weekly chart
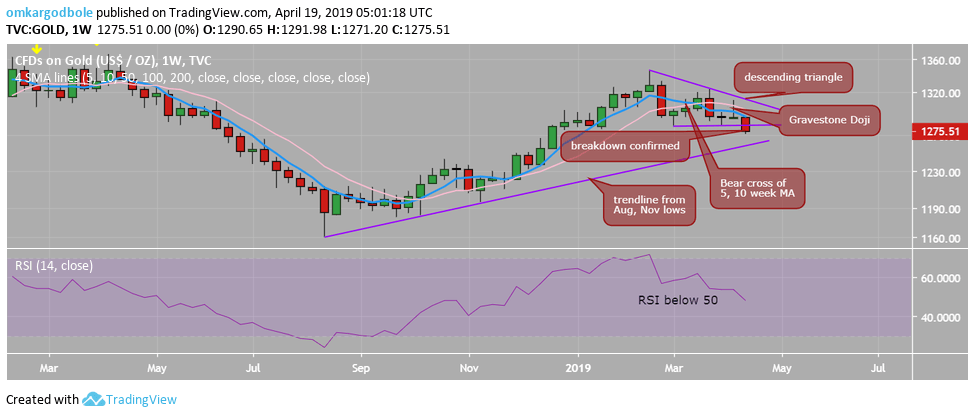
The big red weekly candle reinforces the bearish view put forward by the previous week’s gravestone doji.
Add to that, the triangle breakdown and the descending 5- and 10-week moving averages (MAs) and the metal looks set to test the support of the trendline connecting August and November lows, currently at $1,258. That support is seen rising to $1,261 next week.
The slide to eight-month rising trendline support, however, could be preceded by a minor bounce, as the relative strength index (RSI) on both the 4-hour and hourly charts has diverged in favor of the bulls.
Prices, therefore, could revisit the former support-turned-resistance zone of $1,280-$1,285, before sliding to $1,260 as called by the weekly chart.
Acceptance above the resistance zone of $1,280-$1,285 would weaken the bearish case. A move above that hurdle could happen if the risk-on grips markets.
Improved risk appetite is usually bad news for safe havens like gold. Markets, however, have been treating the greenback as a safe haven for almost 12 months now.
Hence, improved risk appetite and the resulting dollar weakness could bode well for the yellow metal. That said, if the risk-on pushes the dollar higher, then a deeper drop in gold could be seen, as suggested by the weekly chart.
Apart from the broader market sentiment, the focus would also be on the US data, particularly the monthly US durable goods orders report, due next Thursday.
Author

Omkar Godbole
FXStreet Contributor
Omkar Godbole, editor and analyst, joined FXStreet after four years as a research analyst at several Indian brokerage companies.


