Gold price forecast: Caught in a bull-bear tug-of-war

Having clocked a weekly high/low of $1,340/$1,313, gold (XAU/USD) is set to end the week on a flat note at $1,322.
So, the metal is creating a doji candle on the weekly chart, which indicates indecision in the marketplace. A bullish follow-through next week, i.e. weekly close above $1,340 would signal the pullback from the January high of $1,366 has ended at $1,303 (last week's low) and could yield a re-test of $1,366.
On the other hand, a bearish follow-through next week, i.e. a close below $1,300 would open doors for a sustained drop to $1,260 and beyond.
Further, the daily chart also shows conflicting patterns.
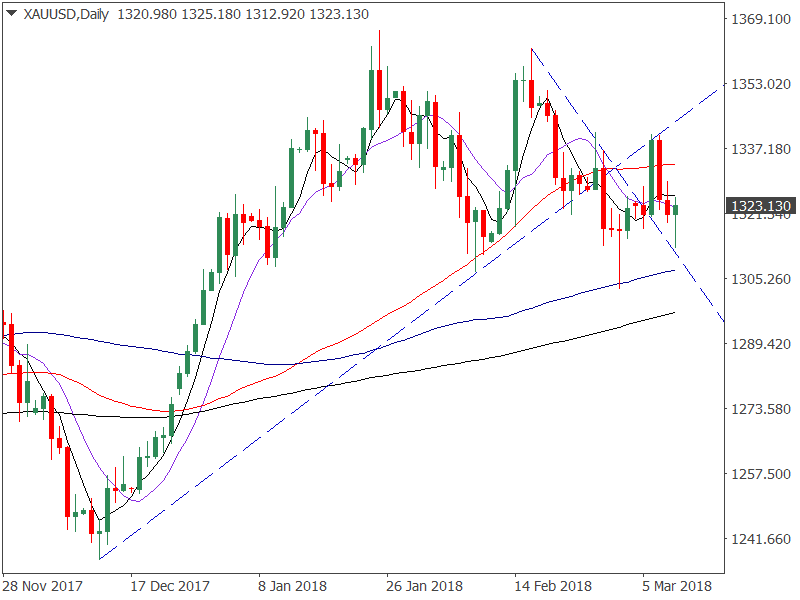
Bull flag pattern

An upside break (on a daily closing basis) would signal a continuation of the rally from the December 2017 low of $1236.50 and allow a stronger rally to $1,496-$1,500 (target as per the measured height method). However, as of now, the target seems far-fetched.
Double top bearish reversal
Many experts feel the price action between Jan. 25 and Feb. 16 looks like a double-top with the neckline support of $1,307. A daily close below the neckline would shift attention to $1,250-$1,240.
So, it is quite clear the yellow metal is caught in a bull-bear tug of war. That said, the recent price action suggests the bulls could soon topple the bears.
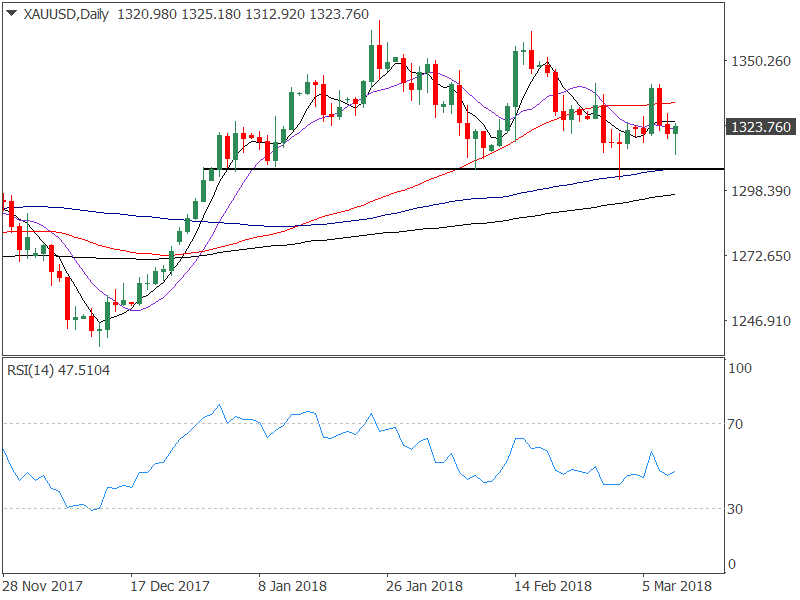
Last week's bull doji reversal is intact
Gold witnessed a bullish doji reversal on March 2, signaling the retreat from the Feb. 16 high of $1,362 has ended and the bulls have regained control.
Accordingly, the metal found bids earlier this week, but the ascent was cut short by the ascending trendline resistance on March 6. The subsequent pullback to lows below $1,320 may have weakened the bulls somewhat.
However, the bullish doji reversal pattern (created last week) is still intact and hence the probability of a bull flag breakout is high.It is worth noting that the low of long-legged doji candle (created on March. 1) was $1,303, i.e. near the psychological support of $1,300.
Hence, a close below $1,300 would confirm - bear doji continuation on the weekly chart, the double top bearish breakdown on the daily chart and invalidation of the bullish doji reversal on the daily chart - and could yield a quick-fire sell-off to $1,240.
Author

Omkar Godbole
FXStreet Contributor
Omkar Godbole, editor and analyst, joined FXStreet after four years as a research analyst at several Indian brokerage companies.


