Gold Price Forecast: Bull breakout likely, Fed continues to expand its balance sheet
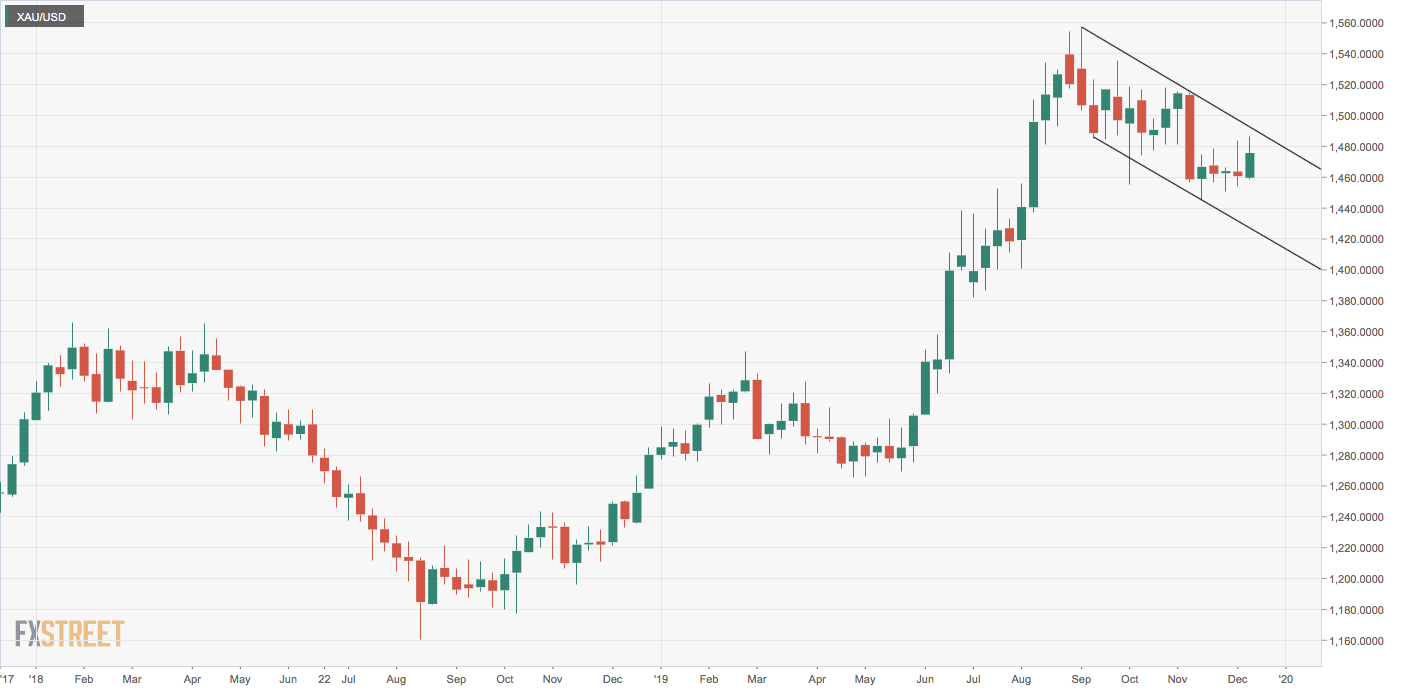
- Gold is stuck in a four-month falling channel.
- Fed's ongoing balance sheet expansion and lingering trade tensions could fuel price breakout.

Gold could soon witness a bullish breakout, courtesy of the US Federal Reserve’s (Fed) continued expansion of its balance sheet.
The yellow metal is currently changing hands at $1,477 per Oz and is set to end the week with a 1.17% gain. That is the biggest weekly gain since the third week of September.
The metal, however, is still trapped in a falling channel represented by September and November highs and October and November lows.
The outlook, therefore, remains neutral, despite the biggest weekly gain in three months.
Fed turns dovish
Gold’s weekly gain could be associated with President Powell’s comments on inflation and interest rates.
While the US central bank kept interest rates unchanged at 1.25-1.5% on Wednesday, Powell offered a dovish surprise by citing persistent high inflation as a prerequisite for rate hikes.
As a result, the dollar was offered across the board post-fed and extended losses on Friday, on the news of the US-China trade deal and due to Brexit optimism generated by British Prime Minister Boris Johnson’s decisive election victory.
Fed’s balance sheet expansion
The central bank is planning to offer a total of $490 billion in liquidity via repo operations for the turn of the year, including the $75 billion that it has already pumped in through three earlier term actions, according to Bloomberg.
The Fed has also announced new term operations totaling $365 billion that will take place this month and in January.
Put simply, the Fed is set to bloat its balance sheet further, having expanded it more than $300 billion since mid-September.
Historically, Fed’s balance sheet expansion programs have boded well for gold. For instance, the initial expansion of the Fed’s balance sheet began in 2009. At that time, the balance sheet was below $1 trillion, but by 2014, it had increased to $4.5 trillion.
During that time frame, gold rose from $800 to $1,200, having peaked at a record high of $1,921 in September 2011. Note that prices fell from highs above $1,600 to $1,200 in the first six months of 2013 due to taper tantrum.
All in all, there is a strong reason to anticipate a near term bullish move in gold on the back of Fed’s balance sheet expansion.
Trade war not over yet
China and the US have reportedly agreed on a ‘phase one’ deal. A press conference by China and tweets by US President Trump confirmed that no additional tariffs will be imposed this Sunday. Additionally, the US has reportedly agreed to halve the tariffs on products worth $110 billion from 15% to 7.5%, according to ING’s note to clients.
As of now, the entire exercise looks like a public relations effort to project Trump as a deal maker ahead of the November 2020 Presidential elections.
Moreover, sensitive issues such as indirect Chinese state subsidies, intellectual property theft and the US' wish that China lets go of its ambition to dominate tech markets are yet to be negotiated.
With trade war still on and phase one deal priced in, gold looks set to pick up a strong bid while heading into the new year.
The bullish pressures would strengthen if the Chinese industrial production and retail sales data due on Monday miss consensus estimates by a big margin. The US Gross Domestic Product (Q3), scheduled for release on Friday, could also influence gold.
Technical outlook
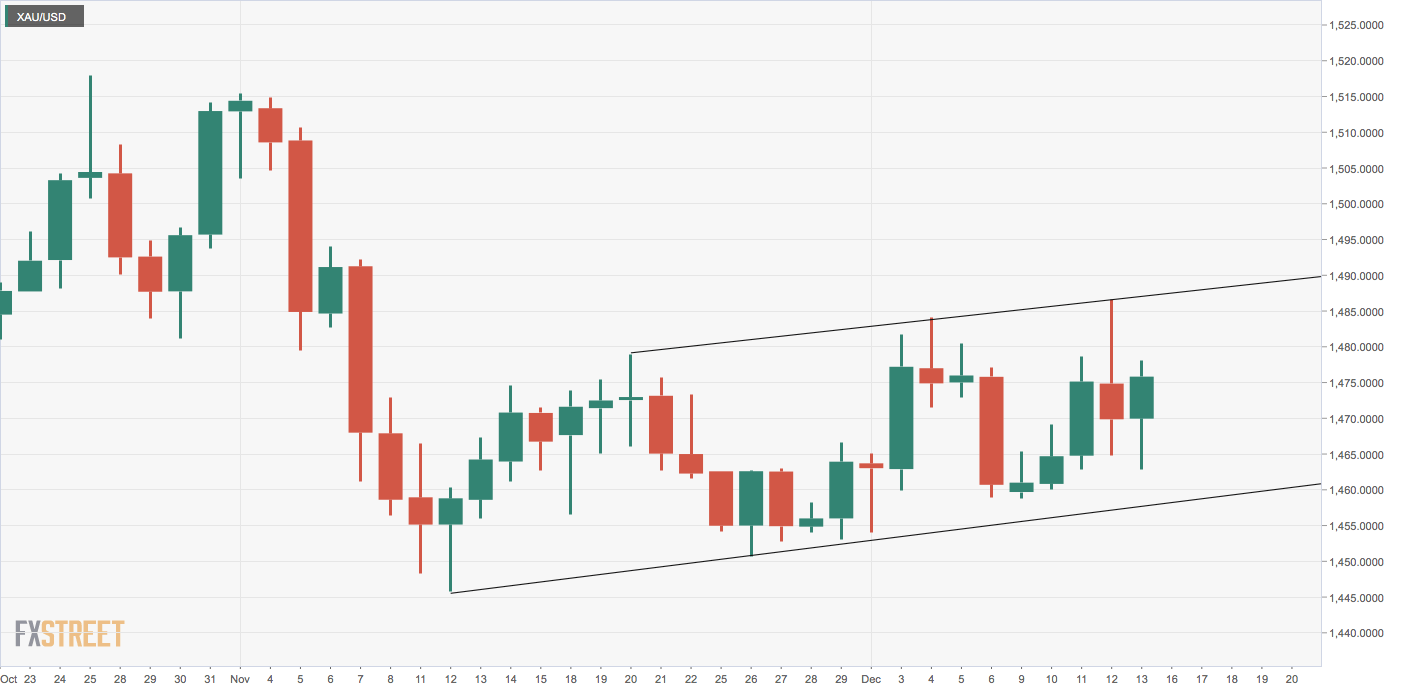
The five weeks of sideways churn has neutralized the bearish setup.
The outlook would turn bullish if and when the metal confirms a falling channel breakout. That would imply a resumption of the rally from lows near $1,270 registered in May and open the doors for a retest of the 2019 high of $1,557 reached in September. The channel resistance would be located at $1,488 next week.
The outlook would turn bearish if the sideways channel seen on the daily chart is breached to the downside. That would validate the bearish crossover of the 50- and 100-day averages and will likely yield a drop to $1,430.
Weekly chart
Daily chart
Gold Forecast Poll
The Forex Forecast Poll is a sentiment tool that highlights near- and medium-term price expectations from leading market experts. As can be seen, the market is bearish on gold across all time frames. The yellow metal is seen falling to $1,464.82 next week and remain around that level four weeks from now. A minor recovery to $1,484 is expected in three months time.
The path of Gold has fallen on a dovish Fed and relief that the Us-China trade deal looks like going through. However, please note that gold buyers historically come into the market around January time for the lunar New Year. So, that is why the 30-day outlook for gold is higher than you might otherwise expect. ETF’s, Hedgefund’s and India.
Author

Omkar Godbole
FXStreet Contributor
Omkar Godbole, editor and analyst, joined FXStreet after four years as a research analyst at several Indian brokerage companies.


