Gold Price Forecast: Breaking bad, could test 200-day MA support

Gold violated the higher highs and higher lows pattern on Monday, opening doors for a deeper pullback to the 200-day moving average (MA) support, located at $1,308.
Daily chart
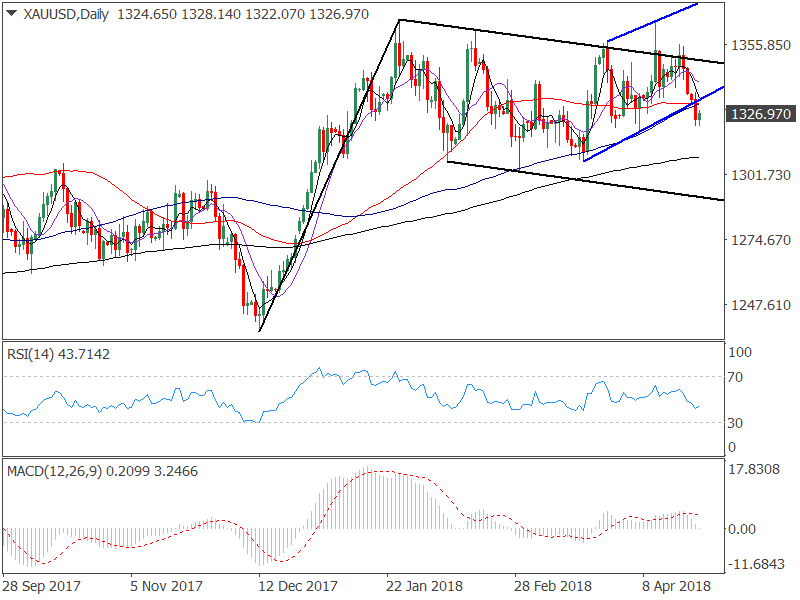
- The downside break of the rising channel adds credence to the repeated full pattern failure and has put the bears back into the driver's seat.
- The 5-day MA, 10-day MA are trending south, indicating a bearish setup. Further, the 50-day MA is set to cross the 100-day MA in a gold-negative manner.
- The relative strength index (RSI) is biased bearish (below 50.00) and the MACD has shed the bullish bias.
The negative setup on the daily chart adds credence to the bearish inside-week candle seen on the chart below
Weekly chart
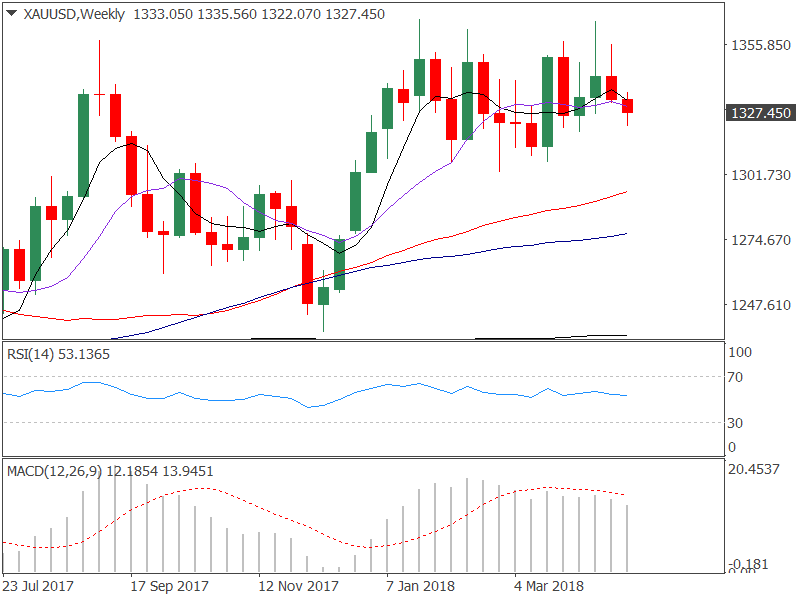
The high-low of last week's bearish inverted hammer last week was within the price range of the preceding week. So, the metal created a bearish inverted inside-week candle last week, which suggests a change in the direction, i.e. the rally from the December low of $1,236.50 has ended and the bears have regained control.
View
The yellow metal could test the 200-day MA support of $1,308 in the next couple of days.
A daily close above $1,340 would abort the bearish view.
Author

Omkar Godbole
FXStreet Contributor
Omkar Godbole, editor and analyst, joined FXStreet after four years as a research analyst at several Indian brokerage companies.


