Gold outlook: Sideways motion maintained

The high volatility that was present in the markets during the past week, provided a rollercoaster ride for gold’s price, yet the precious metal’s price remained in a largely sideways motion. Today we are to discuss the fundamental challenges laid ahead for the precious metal, while we will be concluding this report with a technical analysis of gold’s daily chart.
The Fed’s intentions
On the monetary front, we note that the Fed remained on hold as was widely expected. In its accompanying statement, the bank seems to be taking its time regarding the possibility of any rate cuts. Fed Chairman Powell in his press conference stated that March is not a base scenario for rate cuts. Please note that the market had already shifted before the release, expecting the first rate cut in May. The market seems to expect the bank currently to deliver 5 rate cuts until the year has ended. We tend to be even less dovish and suspect that the bank may start cutting rates in the summer and deliver 3-4 rate cuts in the current year, a scenario that if materialized could keep USD supported on a monetary level. Given the negative correlation characterising gold and the USD, such a scenario may start weighing on gold’s price over the first half of the year. Yet we would expect to see more signals regarding the Fed’s intentions in the coming few days as Fed policymakers are to proceed with their post-decision statements.
January’s employment report
The main market mover of the past week may have been the release of the US employment report for January. The release shook the markets as, despite consensus for an easing of the tightening of the US employment market, the actual rates and figures highlighted its resilience. It’s characteristic that the Non-Farm Payrolls figure instead of dropping as expected, rose to 353k and the jump highlighted the ability of the US employment market to create new jobs. At the same time, the unemployment rate failed to tick up and remained unchanged at 3.7%, highlighting the continuance of the tightness of the US employment market. The release as such, tends to allow more leeway for the Fed to maintain rates high for a longer period, as one part of its mandate, promoting employment, is covered and forces the bank’s focus on bringing inflation down to its 2% target. Furthermore, the release tends to underscore the narrative of the bank for a possible soft landing of the US economy. Market-wise, the release obliged the market to reposition itself and provided substantial support for the USD in Friday’s American session, weighing on the gold’s price again.
US yields and upcoming releases
We expect fundamentals to guide gold’s price in the next few days given the low number of US high-impact financial releases expected, with special focus being on the Fed’s intentions. Yet we would note the release of the US CPI rates for January next Tuesday, as the next big test for gold’s price. Should the rates slow down further, we may see the release weighing on the USD and thus providing a lift to gold’s price. We also note the path of US yields given the competitiveness between gold and US bonds as safe-haven assets. Should US yields continue to rise, we may see them having an adverse effect on gold’s price, as attention may be shifted towards US bonds, given also that the Gold is non-interest bearing asset.
Technical analysis
XAU/USD daily chart
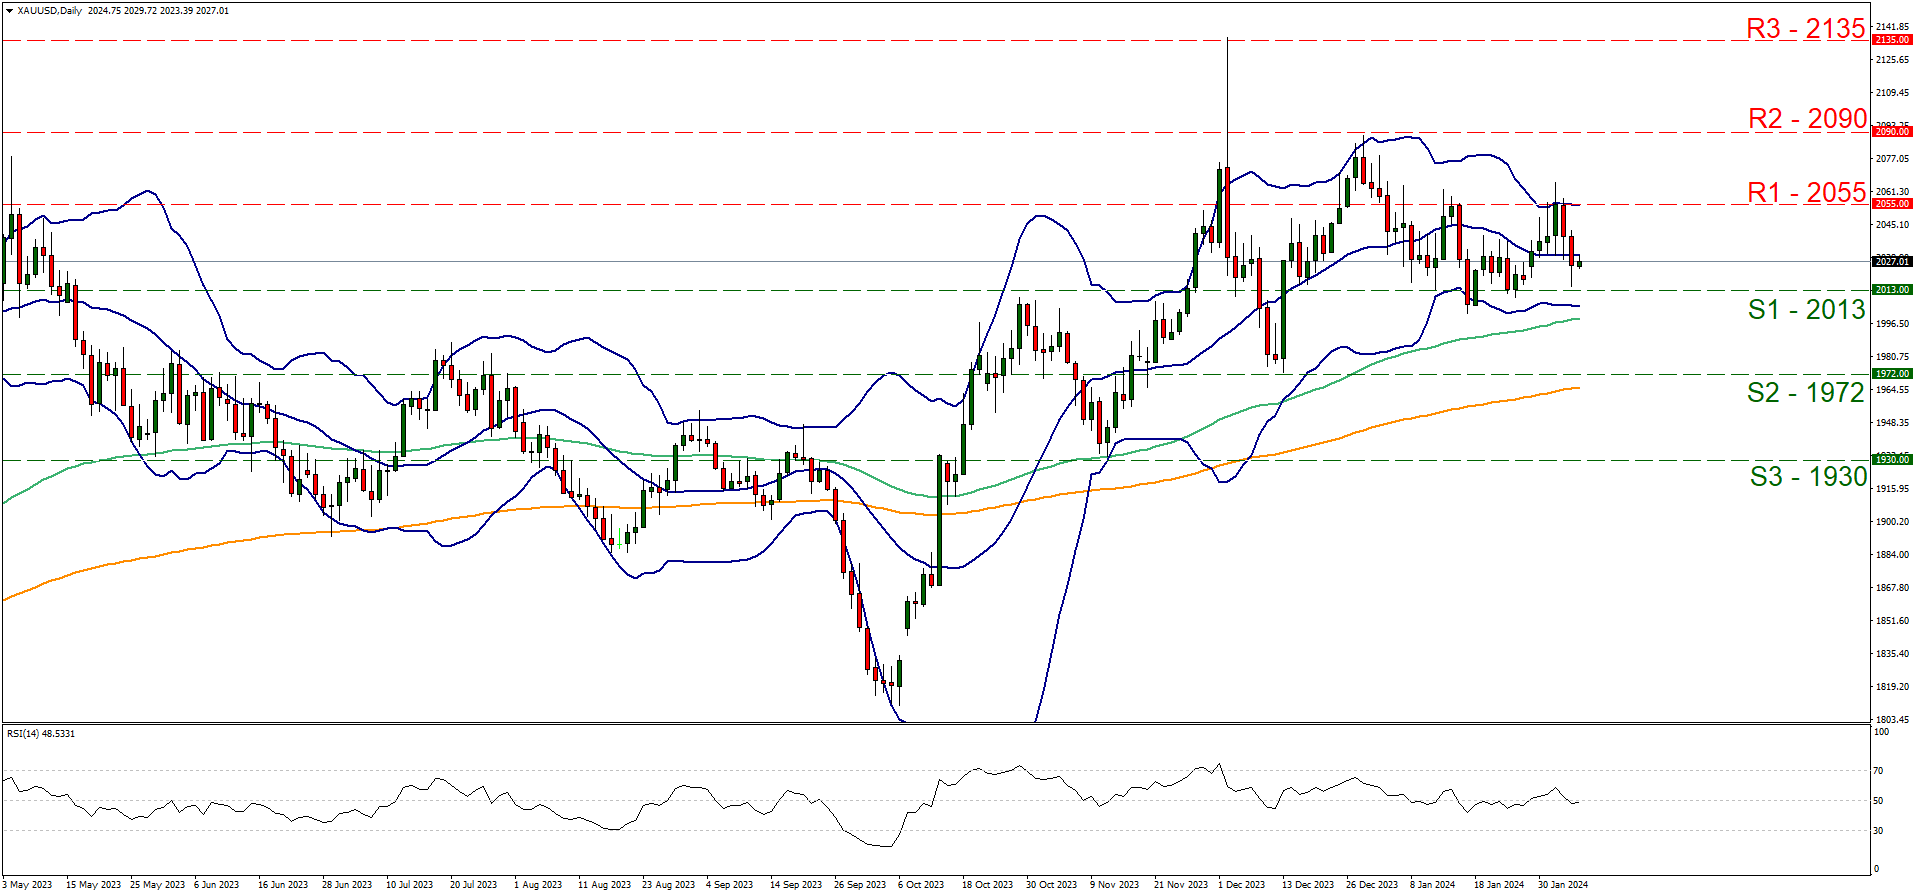
Support: 2013 (S1), 1972 (S2), 1930 (S3).
Resistance: 2055 (R1), 2090 (R2), 2135 (R3).
On a technical level, we note that gold’s price hit a ceiling at the 2055 (R1) resistance line and moved lower bouncing on the 2013 (S1) support level yesterday. Currently, we tend to maintain a bias for the sideways motion of gold between the 2055 (R1) resistance line and the 2013 (S1) support level to be maintained. We base our outlook practically on the fact that the price action of the precious metal was unable to clearly break either of the prementioned levels since the start of the year, thus forming a corridor for the price action to move within. Furthermore, we note that the RSI indicator tends to run along the reading of 50 implying a rather indecisive market, while the Bollinger bands have narrowed implying less volatility for the price of gold, which may allow the sideways motion to continue. For a bullish outlook, we would require to see the precious metal’s price breaking the 2055 (R1) resistance line and aiming for the 2090 (R2) resistance nest, which was aimed for on the 28th of December while even higher we note the practically all-time high of gold’s price at 2135 (R3) resistance hurdle. On the flip side should the bears take over, we may see the bullion’s price breaking the 2013 (S1) support line and aiming for the 1972 (S2) support base, a level last tested on the 13th of December, while even lower we note the 1930 (S3) support barrier as a possible target for the bears, as it reversed the downward motion of gold’s price on the 13th of November last year.
Author

Peter Iosif, ACA, MBA
IronFX
Mr. Iosif joined IronFX in 2017 as part of the sales force. His high level of competence and expertise enabled him to climb up the company ladder quickly and move to the IronFX Strategy team as a Research Analyst. Mr.


