Gold traders remain on the edge of their seats

Gold’s price moved appears to have moved in a relatively sideways fashion since last week. Today we are to discuss the fundamental challenges laid ahead for the precious metal as well as upcoming financial releases that may affect the direction of its price action. Finally, we will be concluding this report with a technical analysis of gold’s daily chart.
Are some Fed policymakers reluctant to cut interest rates?
Fed Governor Bowman stated earlier on today per CNBC, that she was open to raising interest rates if inflation doesn’t improve. The comments made by the Governor tend to imply that the lack of progress in combating inflationary pressures in the US economy means that “we are still not yet at the point where it is appropriate to lower the policy rate”. Moreover, San Francisco Fed President Daly stated yesterday per Reuters, that “the bumpiness of inflation data so far this year has not inspired confidence”. As such, the remarks by San Fransisco Fed President Daly and Fed Governor Bowman may be interpreted as a willingness by Fed policymakers to keep interest rates higher for longer. As such, should more Fed policymakers adopt a more hawkish tone and push back against the market's expectations of two rate cuts by the Fed by the end of the year, it could provide support for the dollar whilst potentially weighing on the precious metal’s price. On the flip side, should Fed policymakers adopt a more dovish tone, it could weigh on the greenback, whilst providing support for the precious metal’s price, given their inverse relationship with one another. Nonetheless, the overall tone emerging from Fed policymakers at this point in time appears to be hawkish in nature, although that remains to be seen.
Mid-East tensions rise
Tensions in the Middle East appear to be on the rise again, as Israel and Hezbollah seem to be on the verge of going to war with one another. In particular, last Tuesday the Israeli military approved “operational plans for an offensive in Lebanon” per the FT. The approval of the “operational plans” appears to have been interpreted as a preparation for a full-blown war between the Israeli military and Hezbollah, as the two sides have been trading fire on an almost daily basis since the beginning of the war between Israel and Hamas in the Gaza strip. Furthermore, the Hezbollah Chief also threatened the European nation of Cyprus in his televised speech, further complicating matters in the region. Nonetheless, the possibility of another war in the Middle East may funnel safe-haven inflows into the precious metal, which may aid its price as the geopolitical stability of the region continues to deteriorate.
US Financial releases
The US Core PCE rate for May which is the Fed’s favourite tool for measuring inflationary pressures in the US economy is set to be released on Friday. The current expectation by economists is for the Core PCE rate to come in at 2.6% which would be lower than the prior rate of 2.8%. Such a scenario would imply that inflationary pressures in the US economy may be easing and as such, may increase pressure on the Fed to ease its monetary policy stance. In turn this could weigh on the greenback, whilst potentially aiding gold’s price given their inverse relationship with one another. However, should the Core PCE rate unexpectedly accelerate and thus imply intensifying inflationary pressures it may provide support for the dollar, whilst potentially weighing on gold’s price.
Technical analysis
XAU/USD daily chart
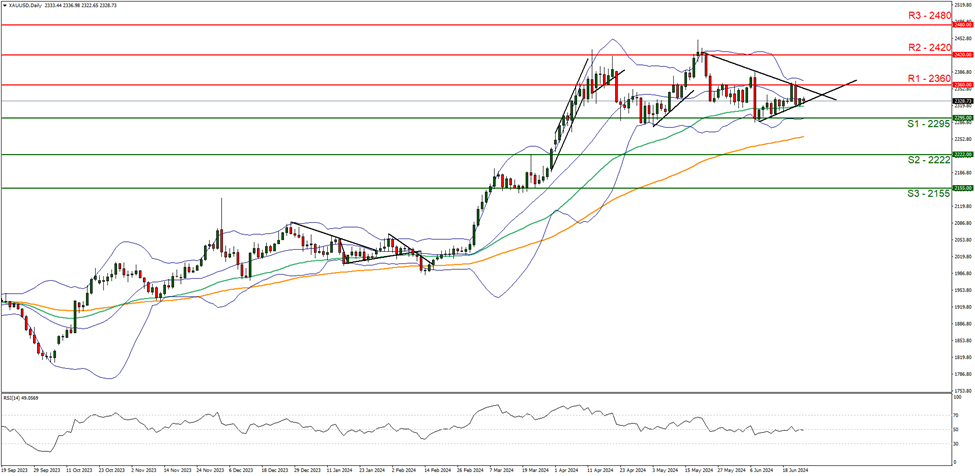
Support: 2295 (S1), 2222 (S2), 2155 (S3).
Resistance: 2360 (R1), 2420 (R2), 2480 (R3).
On a technical level, we note, that gold’s price maintained a sideways motion between 2295 (S1) support line and the 2360 (R1) resistance level, over the past week. Given also that the RSI indicator remains near the reading of 50 implying a rather indecisive market, we tend to maintain our bias for the sideways motion to continue. For our sideways bias to continue, we would require the precious metal to remain confined between the sideways channel defined by the 2295 (S1) support level and the 2360 (R1) resistance line. On the flip side for a bearish outlook, we would require a clear break below the 2295 (S1) support line with the next possible target for the bears being the 2222 (S2) support level. Lastly, for a bullish outlook, we would require a clear break above the 2360 (R1) resistance line with the next possible target for the bulls being the 2420 (R2) resistance level.
Author

Phaedros Pantelides
Independent Analyst
Mr Pantelides has graduated from the University of Reading with a degree in BSc Business Economics, where he discovered his passion for trading and analyzing global geopolitics.


