XAU/USD outlook: Gold steadily near ATH

After a roller coaster ride for gold’s price since the 20th of September, a sideways motion prevailed. Fundamental factors affecting gold’s price include the recent financial data from the US, the Fed’s intentions, the negative correlation of the USD with gold’s price and an ongoing uncertainty being generated by the Israeli-Palestinian conflict, while we also worry for the escalating tensions between South and North Korea. We will be concluding this report with a technical analysis of gold’s daily chart.
Gold’s negative correlation with USD not in effect
The negative correlation of the USD with gold’s price has been interrupted over the past week. Over the past week, the USD continued to strengthen against its counterparts, while the gold’s price failed to materially drop. Similarly to gold’s price US bond yields remained steady at relatively high levels since our last report, failing to affect the precious metal’s price. Hence for the time being we abandon the focus on USD’s movement in conjunction with gold’s price and intend to focus on other factors, yet should the USD continue to strengthen or should US yields renew the upward tendencies, we may see gold traders not being able to ignore the greenback’s rally, or even preferring US bonds which ae interest bearing instead of gold.
The Fed’s intentions
On the other hand we may see the Fed’s intentions affecting the gold’s price. After the release of the US employment report for September, sowing a hotter employment market in the US, the market’s expectations for another double rate cut have been erased. Now Fed Funds Futures imply that the market widely expects the bank to proceed with 25 basis points rate cuts in each meeting, which is in accord also with the September dot plot. Our worries though were generated by the release of the US CPI rates for September last week, as the inflation report for the past month came in hotter than expected. The release of the Fed’s meeting minutes did not reveal anything substantially new, yet Fed policymakers sent out mixed signals, with some even casting doubt on the expected two rate cuts. Should we see more Fed policymakers being inclined towards less rate cuts or doubting the market’s expectations, we may see gold’s price retreating.
The Israeli-Palestinian conflict to heat up
The war in the Middle East is ongoing, with Israeli forces pounding the North of Gaza and southern Lebanon, even UN positions. In a latest development the Israeli Cabinet, seems to have reached full consensus on the method, timing and strength of the response to the Iran attack during security consultations- The plan to strike Iran awaits approval from the security cabinet for implementation. Despite Israeli President Netanyahu telling US President Biden that Israel will avoid hitting Iran’s nuclear facilities and oil facilities, thus easing market worries somewhat, a possible retaliatory hit by Israel on Iranian targets may cause an Iranian response. Overall uncertainty remains at high levels as do the stakes involved in the conflict and a possible flare up could provide safe haven inflows for the precious metal.
North-South Korea tensions escalate
The tensions between the two Koreas have been on the rise since the start of the year. In a latest episode North Korea blew up the roads connecting it with South Korea, in a deeply symbolic move, while South Korean military fired warning shots. The rhetoric of the two sides has been hardening over the past week, with analysts highlighting the possibility of nuclear conflict rising. On the other hand, there is also the possibility that North Korea is hardening its stance in an effort to be recognized as a nuclear power or to get some leverage in future possible negotiations. It’s characteristic that North Korea sides with Russia on a geopolitical level, while South Korea is in the US camp. Overall we still view North Korea as major security threat for the area, yet an overemphasizing of the issue by media, may also be in play. In any case given the unpredictability of North Korea, the issue could have implications for golds’ price as well. Should we see the tensions escalating further, we may see the safe haven inflows for gold, while a possible de-escalation could weigh on gold’s price.
Technical analysis
XAU/USD daily chart
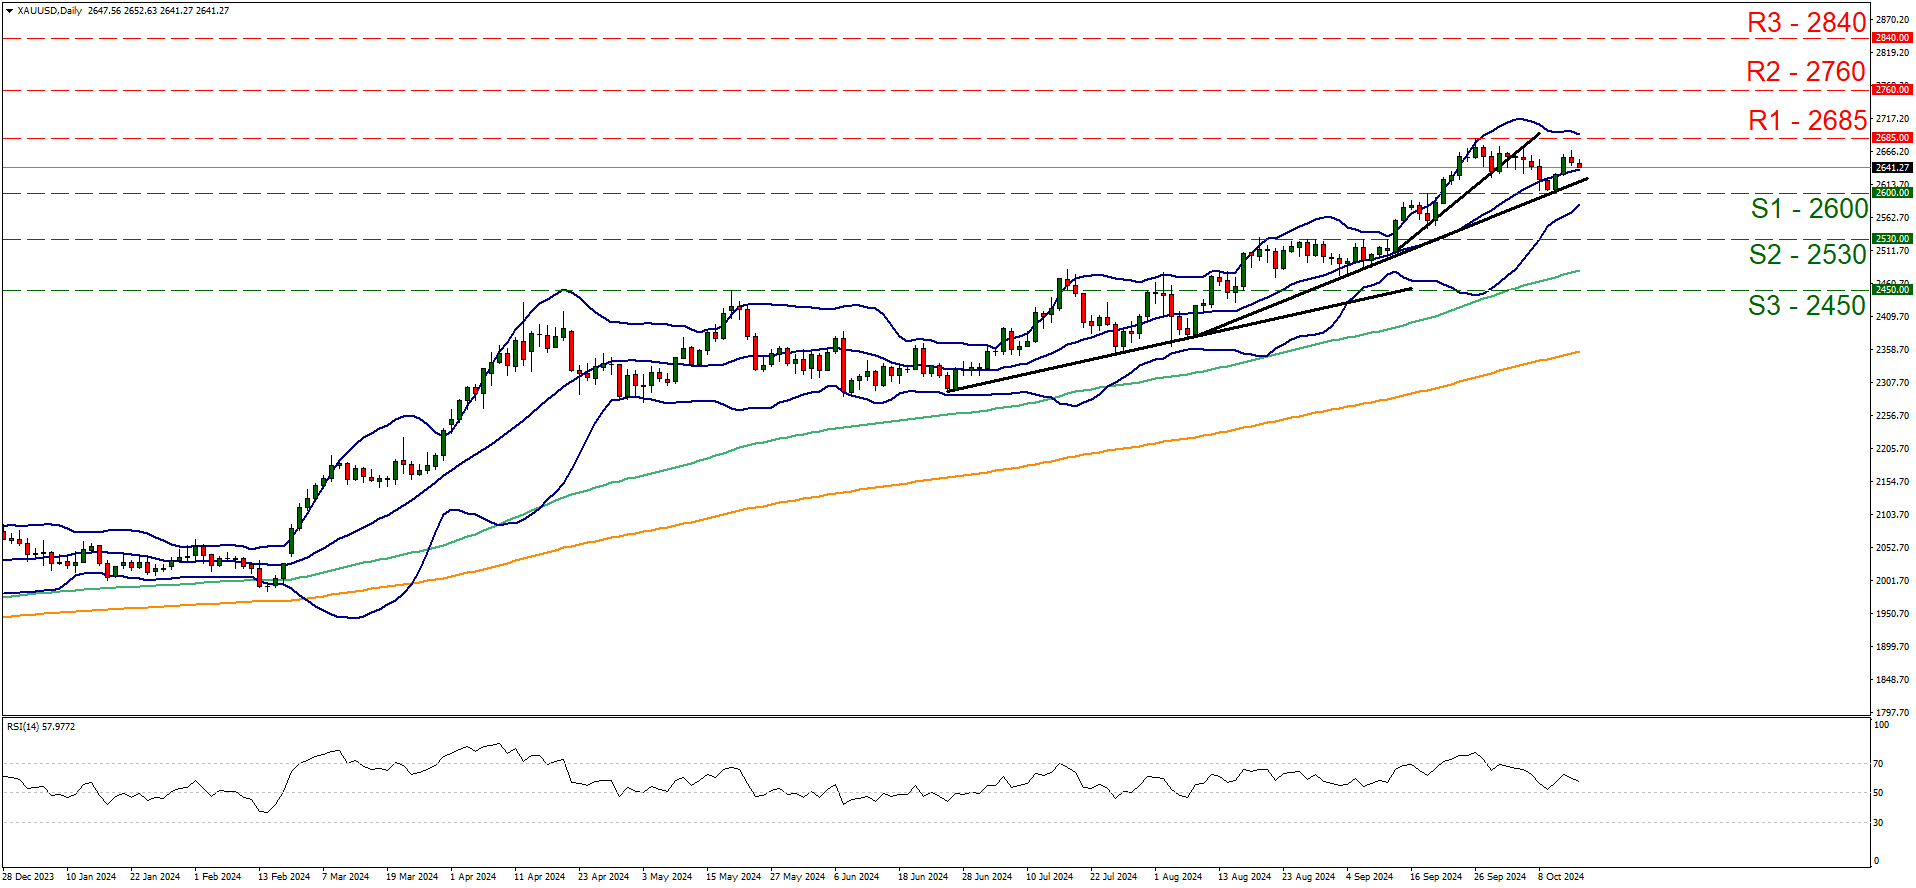
Support: 2600 (S1), 2530 (S2), 2450 (S3).
Resistance: 2685 (R1), 2760 (R2), 2840 (R3).
Gold’s price edged higher after hitting on the 2600 (S1) support line, allowing for a sideways motion to prevail, with the boundaries being set between the 2685 (R1) resistance line and the 2600 (S1) support level. We tend to maintain a bias for the sideways motion to continue given also that the RSI indicator remains above but close to the reading of 50, implying a rather indecisive market. Furthermore the Bollinger bands seem to converge implying less volatility for the precious metal’s price which in turn could allow the sideways motion to be maintained. On the other hand the upward trendline incepted since the 8th of August is still intact, yet for the time being the price action seems to have hit a ceiling at the 2685 (R1) resistance line. Hence, for a bullish outlook we would require the precious metal’s price to breach the 2685 (R1) resistance line, which is also a record high level for gold’s price and set the next possible target for the bulls at the 2760 (R2) resistance level. On the flip side, should the bears take over, we may see the bullion’s price breaking the prementioned upward trendline, in a clear signal that the upward movement has been interrupted, breaking the 2600 (S1) support line which has been the floor of the current sideways motion and start aiming for the 2530 (S2) support level, which used to be a resistance level, yet given that the price action has moved above it its role has been reversed.
Author

Peter Iosif, ACA, MBA
IronFX
Mr. Iosif joined IronFX in 2017 as part of the sales force. His high level of competence and expertise enabled him to climb up the company ladder quickly and move to the IronFX Strategy team as a Research Analyst. Mr.


