XAU/USD outlook: Gold eyes all-time highs

Gold’s price seems to have found support since our last report with the precious metal now eyeing its all-time high figure of $2136. The market’s expectations for the Fed’s intentions and recent tensions in the international scene appear to have influenced the path of Gold’s price in the past few days. Today we are to discuss the fundamental challenges laid ahead for the precious metal, while we will be concluding this report with a technical analysis of gold’s daily chart.
The Fed’s intentions
Gold market participants continue to monitor the Fed’s intentions, with market expectations for a rate cut by the Fed in June seemingly on the rise. Currently, Fed Fund Futures imply a 69.2% probability for the bank to cut interest rates during their June meeting. The rising expectations by market participants may have weighed on the greenback on a fundamental level, thus allowing the precious metal to capitalize on the dollar’s inactivity and move higher given their inverse relationship. However, we should note that FFF expectations on Monday for a June rate cut were higher at 71.7 and that their slight decrease could be attributed to comments made by Atlanta Fed President Bostic on Monday. In particular, the policymaker in his speech stated that “it is premature to claim victory in the fight against inflation”, thus raising the question as to whether Atlanta Fed President Bostic amongst other policymakers, is contemplating if they should cut rates 3 times this year, or if they should defy market expectations and cut less or none at all. As such, should other policymakers and in particular Fed Chair Powell, who is expected to speak tomorrow, re-iterate these hawkish remarks, we may see the dollar gaining which in turn could weigh on Gold’s price given their inverse relationship with one another.
US yields
The relative deterioration of US yields over the past week may also have allowed gold’s price to rise, as the interest-bearing assets become less appealing to investors, thus potentially funnelling inflows into the precious metal. Furthermore, should the US Yields continue their decline, thus reducing their appeal to investors even further, we would not be surprised to see gold’s price moving higher. On the other hand, should US yields rise, thus allowing bonds to regain their appeal, it could weigh on the non-interest-bearing precious metal.
China-Taiwan
China’s much-anticipated National People’s Congress for 2024 is underway and is due to end later this week. On Tuesday Premier Li Qiang, China’s number two delivered a government report during the opening of the National People’s Congress, in which the language against Taiwan has apparently toughened, with the Chinese Government dropping the mention of a “peaceful reunification” with the island, which it considers to be a breakaway region from the mainland. The adoption of harsher rhetoric may imply that China is preparing to bring the island back into the fold, with military means if necessary. Such a scenario, appears to be in line with comments made by President Xi Jinping during his New Year’s address last December in which he stated that China’s reunification with Taiwan is inevitable. As such, with the risk of geopolitical tensions in the region seemingly increasing in the current year, gold may see safe haven inflows given its status as a hedge during times of uncertainty.
Technical analysis
XAU/USD daily chart
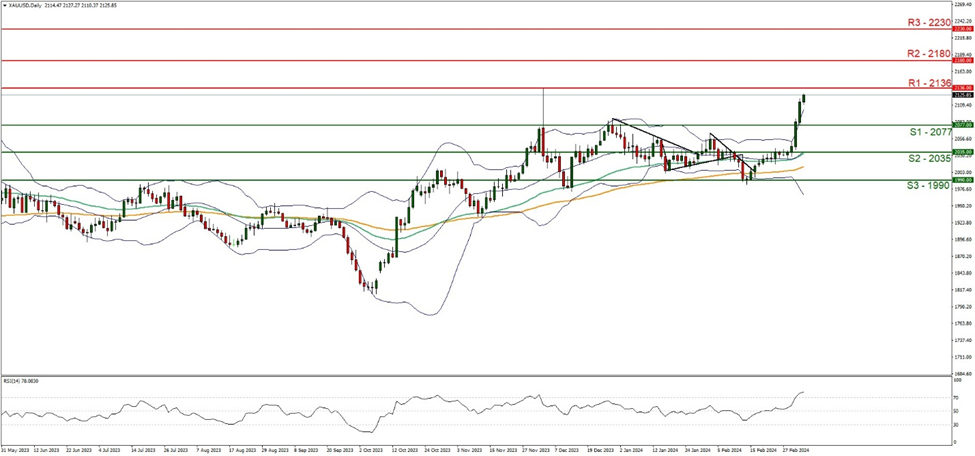
Support: 2077 (S1), 2035 (S2), 1990 (S3).
Resistance: 2136 (R1), 2180 (R2), 2230 (R3).
On a technical level, we note that gold’s price has rapidly ascended the past few days breaking levels last seen on the 27th of December 2023 and as a matter of fact, the precious metal now appears to be eyeing its all-time high figure of 2136. We maintain a bullish outlook for gold’s price and supporting our case is the RSI Indicator below our chart which currently registers a figure above 70, implying a strong bullish market sentiment. However, we would like to note that the aforementioned figure, could also imply that the precious metal may be at overbought territory and may be due a market correction to lower ground, as the Bollinger bands have also widened significantly implying high market volatility. Nonetheless, for our bullish outlook to continue, we would require a clear break above its all-time high figure at the 2136 (R1) resistance level, with the next possible target for the bulls being the 2180 (R2) resistance ceiling. On the other hand, for a neutral outlook, we would like to see the precious metal’s price to remain between the 2136 (R1) resistance level and the 2077 (S1) support line. Lastly, for a bearish outlook we would like to see a clear break below the 2077 (S1) support line with the next possible target for the bears being the 2035 (S2) support base.
Author

Phaedros Pantelides
IronFX
Mr Pantelides has graduated from the University of Reading with a degree in BSc Business Economics, where he discovered his passion for trading and analyzing global geopolitics.


