Gold outlook: December’s US employment report the next big test for Gold

Gold’s price opened the year in a relatively stable manner with no major fluctuations in the holiday period. In today’s report, we intend to have a look at the Fed’s stance and how it may affect gold’s price, upcoming financial releases that my prove to be market movers for the precious metal’s price and lastly a look at geopolitics. For a rounder view, we conclude the report with a technical analysis of gold’s daily chart.
The Fed’s stance
The Fed seems to continue to hesitate in cutting rates further. Currently Fed Fund futures imply that the market expects the bank to proceed with a rate cut in the May meeting and remain on hold after that until the end of the year, with a December 2025 being currently highly doubtfull. Yet, in its latest dot plot the bank signaled two rate cuts within the year. We also note the latest comment by Fed Board Governor Lisa Cook where she stated that "the labor market has been somewhat more resilient, while inflation has been stickier than I assumed at that time …Thus, I think we can afford to proceed more cautiously with further cuts". Hence should the Fed start sounding more dovish than what the market expects, we may gold prices getting some support.
December’s US employment report
On Friday we highlight the release of December’s employment report as the next big test for gold prices. The Non-Farm Payrolls (NFP) figure is expected to drop to 154k after November’s stellar 227k, the unemployment rate to remain unchanged at 4.2% and the average earnings growth rate also to remain unchanged at 4.9% yy. Should the rates and figures come in as expected, we may see the drop of the NFP figure disappointing traders somewhat and thus allow for a more dovish stance on behalf of the Fed, thus weighing on gold’s price somewhat, albeit most would have been priced in allready. Yet the actual release is well known to take the markets by surprise and should it show a tighter than expected employment market for the past month we may see it weighing on gold’s price and vice versa.
Gold’s negative correlation with the USD interrupted
Over the past week we saw USD’s value, as expressed by the USD Index, going through a roller coaster rise, with a strong rise on Monday till Thursday and from Friday onwards correcting lower. On the flip side gold did not show any such volatility, remaining relatively stable throughout the week, thus we could say that he negative correlation of the two trading instruments since the last days of December, was not in effect. Furthermore, we also note that US bond yields rose slightly since the 30th of December and should that upward tendency intensify, we may see it having a bearish effect on gold’s price, given the antagonistic nature of gold and US bonds.
Tensions in geopolitics and PBoC’s Gold buying spree
Since our last report there were substantial developments on a geopolitical level, with the situation in the Middle East still being unresolved and despite market worries easing somewhat about the issue, it’s still simmering under the surface. Also the war in Ukraine is ongoing with the Ukrainians making a new attack. In both cases the incoming Trump presidency is expected to be a catalyst, which may intensify uncertainty and thus act a supportive role for gold’s price. Also we note that despite gold’s price trading just below record high levels, China’s central bank expanded its gold reserves for a second month in December, signaling renewed appetite after temporarily pausing purchases last year as prices soared, as per Bloomberg. Should we see PBoC continuing to be in a net buying position in January, it could also provide a boost to gold’s price.
Technical analysis
XAU/USD daily chart
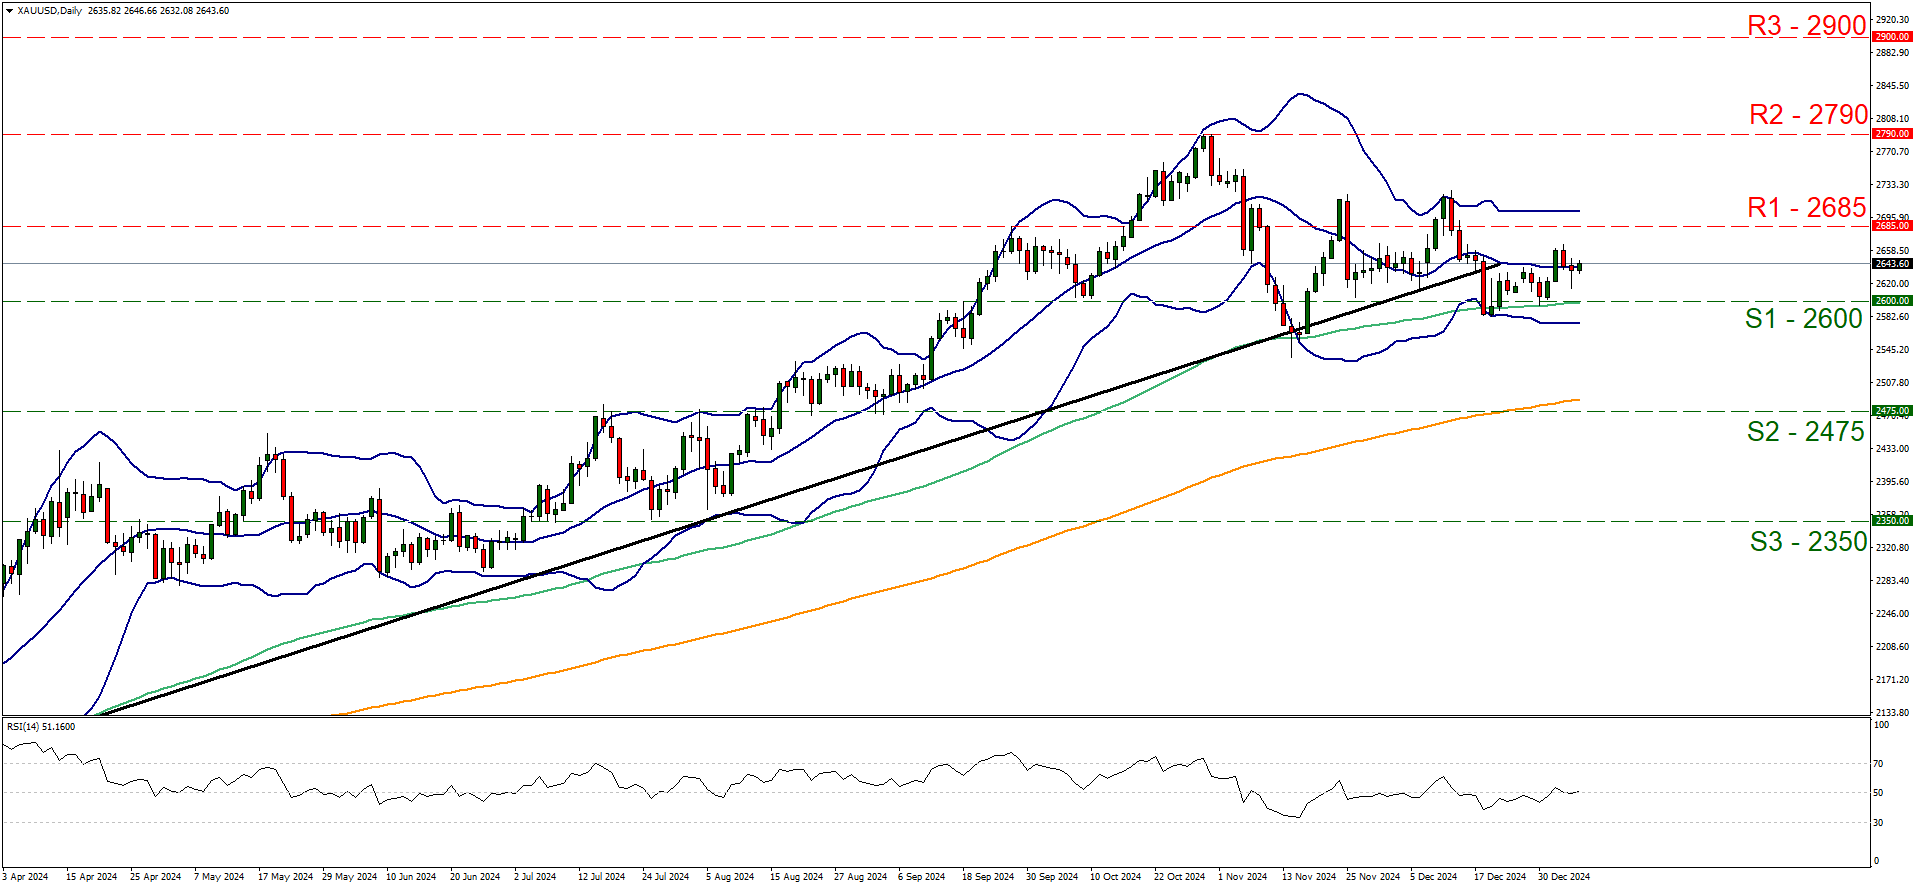
Support: 2600 (S1), 2475 (S2), 2350 (S3).
Resistance: 2685 (R1), 2790 (R2), 2900 (R3).
On a technical level, gold’s price remained relatively stable well within the boundaries of the 2685 (R1) resistance line and the 2600 (S1) support line, as the precious metal’s price continues to be moving in a sideways fashion, within the same boundaries since the 25th of November. We note that the price action of gold has been supported by an upward trendline incepted since the 14th of February yet the stabilisation of gold’s price over the past two weeks tells a different story. We maintain our bias for the sideways motion to continue for the time being and note that the RSI continued to run along the reading of 50 implying a relative indecisiveness among market participants. Also please note that the Bollinger Bands have remained narrow reflecting the lower volatility of the price action, which in turn may allow the sideways motion to continue. For the time being we maintain the 2685 (R1) resistance line and the 2600 (S1) support line as the upward and downward boundaries of the rangebound movement respectively. We note the slight upward movement on Thursday yet, for a bullish outlook, we would require a clear break above the 2685 (R1) resistance line with the next possible target for the bulls being the 2790 (R2) resistance ceiling, which is also a record high level for the shiny metal. Even higher we note the 2900 (R3) as a possible target for gold bulls, should the bullion’s price enter unchartered waters. Lastly, for a bearish outlook, we would require a clear break below the 2600 (S1) support line and the precious metal’s price to start aiming actively for the 2475 (S2) support base. In an extremely bearish scenario, we may see the pair aiming for the 2350 (S3) hurdle, which has not seen any price action since July.
Author

Peter Iosif, ACA, MBA
IronFX
Mr. Iosif joined IronFX in 2017 as part of the sales force. His high level of competence and expertise enabled him to climb up the company ladder quickly and move to the IronFX Strategy team as a Research Analyst. Mr.


