![]() Muhammad Umair, PhD
Muhammad Umair, PhD
Gold Predictors
The international gold market is continuing its price correction phase as we anticipated in our previous review. As the market dynamics oscillate, the correlation between gold prices, U.S. consumer spending, and macroeconomic indicators such as diesel prices create a fascinating tableau of interconnected influences. The gold market charts offer insightful trends about the bull and bear phases and potential strong support for upcoming investment decisions.
As per our recent analysis, gold prices are undergoing a correction phase, with the metal trading between the well-defined support and resistance levels. Despite the robust resistance experienced around the $2,075 mark, the precious yellow metal has managed to stay afloat above the 10 and 20-month moving averages. The market is demonstrating a healthy consolidation, preparing for its next significant move.
US consumer spending and economic signals
The American consumer market continues to show resilience with steady spending patterns. However, the economic compass indicates a looming slowdown. The precursors are evident in the subtle shift in commodities such as diesel prices.
Diesel prices, despite a restricted supply, have been recording a downward trend – a reliable indicator of contracting economic activity. This trend affects commodities across the board, with the gold market not being an exception. Investors must hence factor in these broad economic indicators when planning their gold trading strategies.
The bull and bear phases
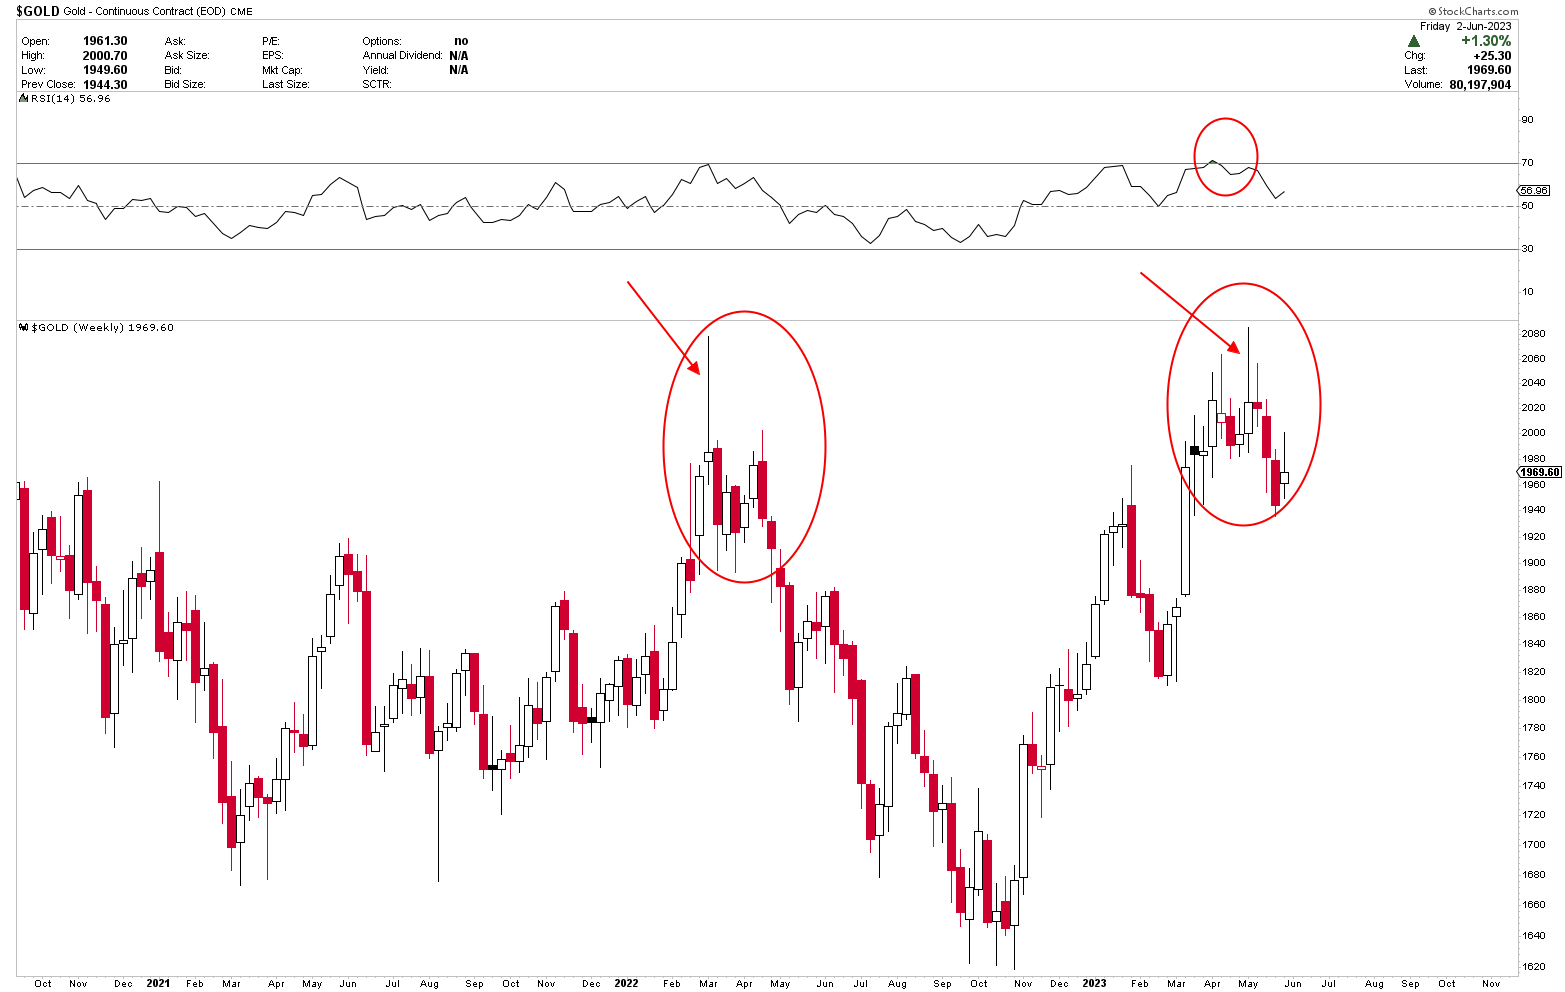
The monthly chart for the gold market elucidates the bull and bear phases distinctly, using the 10 and 20-month moving averages. Despite the resistance at the $2,075 zone, gold prices continue to trend above these averages, indicating a generally bullish outlook in the medium term.
Interestingly, the $1,905 level aligns seamlessly with the 10-month moving average, while the $1,800+ midpoint corresponds with the 20-month moving average. These levels play a crucial role in shaping market sentiment and future price movements. Given the current trajectory of the gold market’s correction, it’s plausible to anticipate a strong bounce from the $1,900 region. This level also happens to be the Fibonacci retracement support of the recent price surge, further cementing its significance.
-638215591415802785.png)
Short-term perspective: Daily and weekly chart Insights
The weekly chart reinforces the imminent encounter of the gold market with a robust barrier. A reaction appears to be on the cards, and market participants will be keenly watching how gold prices react at this crucial juncture.
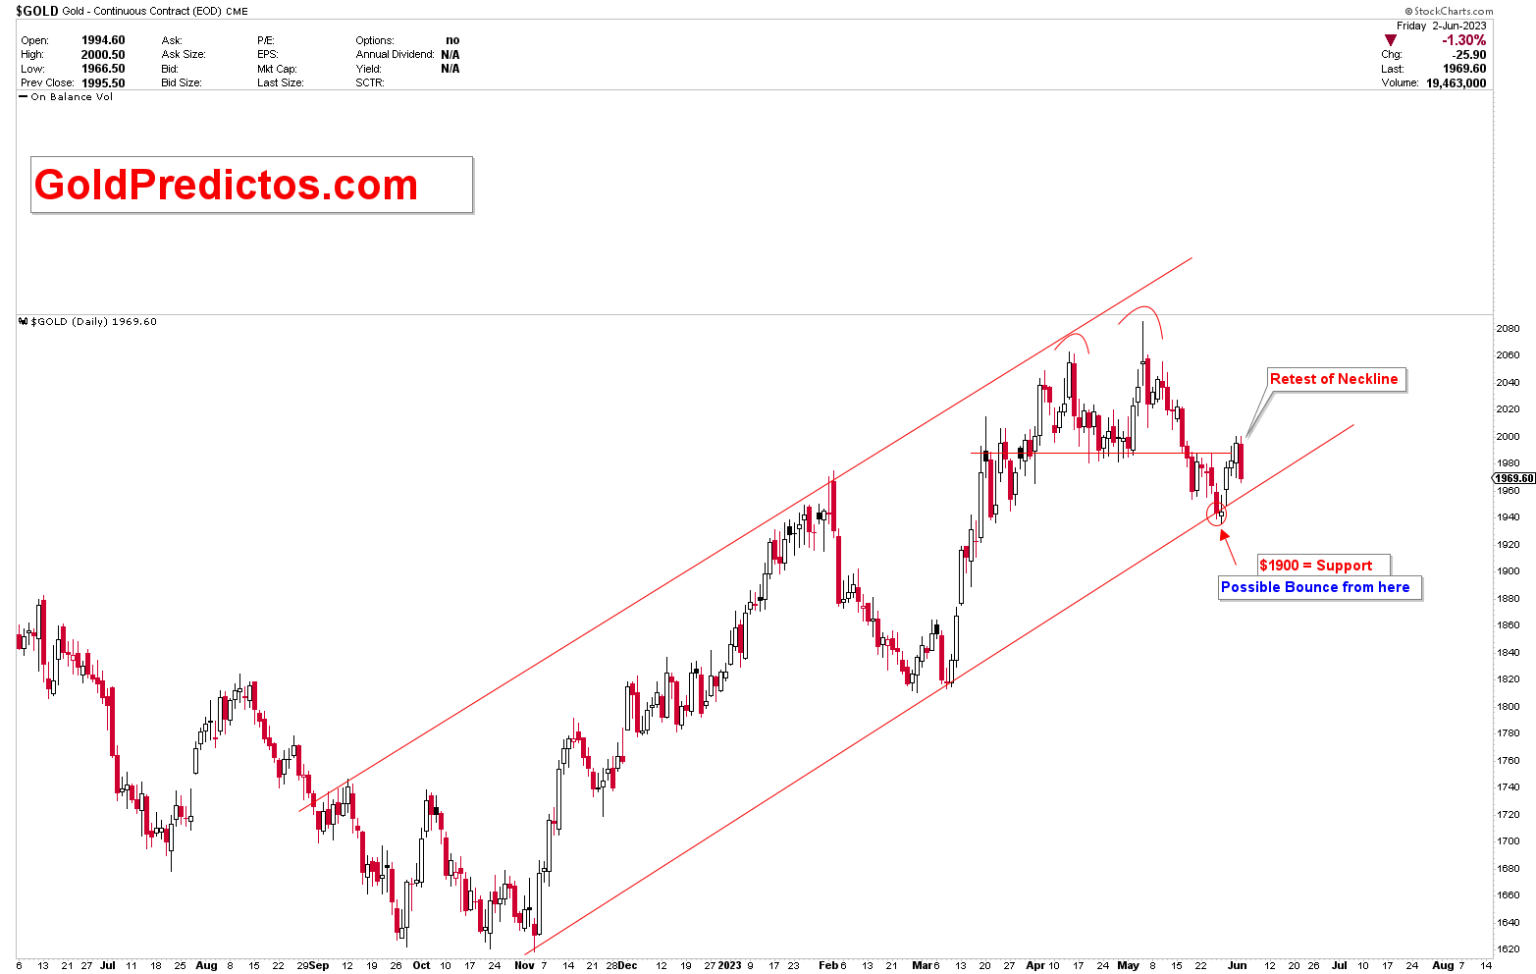
The daily chart clearly presents the short-term outlook for the gold market. As discussed in our last week’s article, the gold price rebounded from the channel line, suggesting a return of bullish sentiment. However, this rebound was limited at the double top’s neckline, instigating the price to resume its downward path. Given the current conditions, it appears the price could potentially drop further, opening opportunities for buyer influence in the market.
Final words
In summary, the region between $1,900 to $1,950 emerges as a strong support zone. Although the first support at $1,950 was tested, the gold price seems to be seeking further validation and might continue its downward trajectory to find robust support around the $1,900 mark.
The ongoing price correction, coupled with the U.S. economic indicators, presents both challenges and opportunities for gold traders and investors. Staying informed and understanding the subtle nuances of these market movements is key to successful gold trading. As we continue to monitor these trends, our goal is to provide valuable insights that empower your investment decisions.
To stay updated with the latest news and receive valuable insights on gold and silver trading, we invite you to subscribe by following the link provided below. By subscribing, you will gain access to a wealth of information, including free updates and alerts tailored specifically to the dynamic world of precious metals trading. Our team of experts is dedicated to keeping you informed about market trends, price fluctuations, and significant developments that may impact your investment decisions. Don’t miss out on this opportunity to enhance your understanding of gold and silver markets. Click the link below to subscribe and embark on your journey towards becoming a well-informed trader.
Articles/Trading signals/Newsletters distributed by GoldPredictors.com have no regard to the specific investment objectives, financial situation, or the particular needs of any visitor or subscriber. Any material distributed or published by GoldPredictors.com or its affiliates is solely for informational and educational purposes and is not to be construed as a solicitation or an offer to buy or sell any financial instrument, commodity, or related securities. Plan the strategy that is most suitable for your investment. No one knows tomorrow’s price or circumstance. The intention of the writer is only to mention his thoughts and ideas that may be used as a tool for the reader. Trading Options and futures have large potential rewards, but also large potential risks.
Recommended Content
Editors’ Picks

AUD/USD: Extra consolidation appears on the cards
AUD/USD set aside a two-day recovery past the 0.6300 hurdle and came under pressure on Wednesday, always in response to US tariff fears and the marked bounce in the Greenback.

EUR/USD: Further downside could retest the 200-day SMA
EUR/USD accelerated its losses and retested lows near the 1.0740 zone on the back of the stronger US Dollar and persistent jitters surrounding potential tariffs on EU imports as soon as next week.

Gold remains slightly offered just above $3,000
Gold is trading in a narrow range on Wednesday but continues to hold firm just above the $3,000 mark. The precious metal is drawing support from upbeat sentiment in the broader commodities space, buoyed by Copper’s surge to a fresh all-time high earlier in the day.

Crypto Today: SHIB, DOGE and PEPE enter $6B gains as BTC aims at $90k
Cryptocurrency market capitalization dips 1.3% to hit $2.9 trillion on Tuesday, with market indicators showing capital rotation toward memecoins.

Sticky UK services inflation shows signs of tax hike impact
There are tentative signs that the forthcoming rise in employer National Insurance is having an impact on service sector inflation, which came in a tad higher than expected in February. It should still fall back in the second quarter, though, keeping the Bank of England on track for three further rate cuts this year.

The Best brokers to trade EUR/USD
SPONSORED Discover the top brokers for trading EUR/USD in 2025. Our list features brokers with competitive spreads, fast execution, and powerful platforms. Whether you're a beginner or an expert, find the right partner to navigate the dynamic Forex market.