Gold maintains strength amid inflationary trends
-
Easing inflation could lead the Federal Reserve to adopt a more cautious monetary policy.
-
Lower interest rates may make gold more attractive as a non-yielding asset.
-
Technical charts suggest a potential bullish breakout in gold, with strong double-bottom formations.

The recent U.S. CPI report shows a modest rise in headline and core inflation rates. Gold tends to react inversely to inflation data and interest rate expectations. The slight undershoot of headline inflation at 2.9% YoY suggest that inflationary pressures are easing. This trend could lead the Federal Reserve to adopt a more cautious approach to its monetary policy, potentially slowing the pace of interest rate hikes or even considering cuts. Such an environment could make gold more attractive as lower interest rates reduce the opportunity cost of holding non-yielding assets like gold.
However, the gold market may also face headwinds from other economic indicators. The resurgence in shelter costs and the uptick in the super core inflation metric could signal persistent inflationary pressures, complicating the Fed's decision-making process. If these factors lead to a slower-than-expected decline in inflation, the Fed might maintain a tighter policy stance longer than expected, strengthening the U.S. dollar and weighing on gold prices. Conversely, if the Fed leans towards a rate cut due to slowing economic growth, gold could benefit from renewed investor interest as a safe-haven asset.
Gold remains strong after the inflation data
The technical chart below indicates that gold prices remain within the red channel lines and are trading at the upper level of resistance. The price reached a strong resistance level at $2480 before the release of the CPI data and then dropped lower. However, the drop in gold prices following the CPI data was mostly recovered, and prices are now poised for an upper breakout. This strength is further reflected in silver prices, which have started to lead the gold market. This movement is causing the gold-to-silver ratio to approach a top at the resistance level. A top in the gold-to-silver ratio may signal a bottom in gold and potentially break the resistance line.
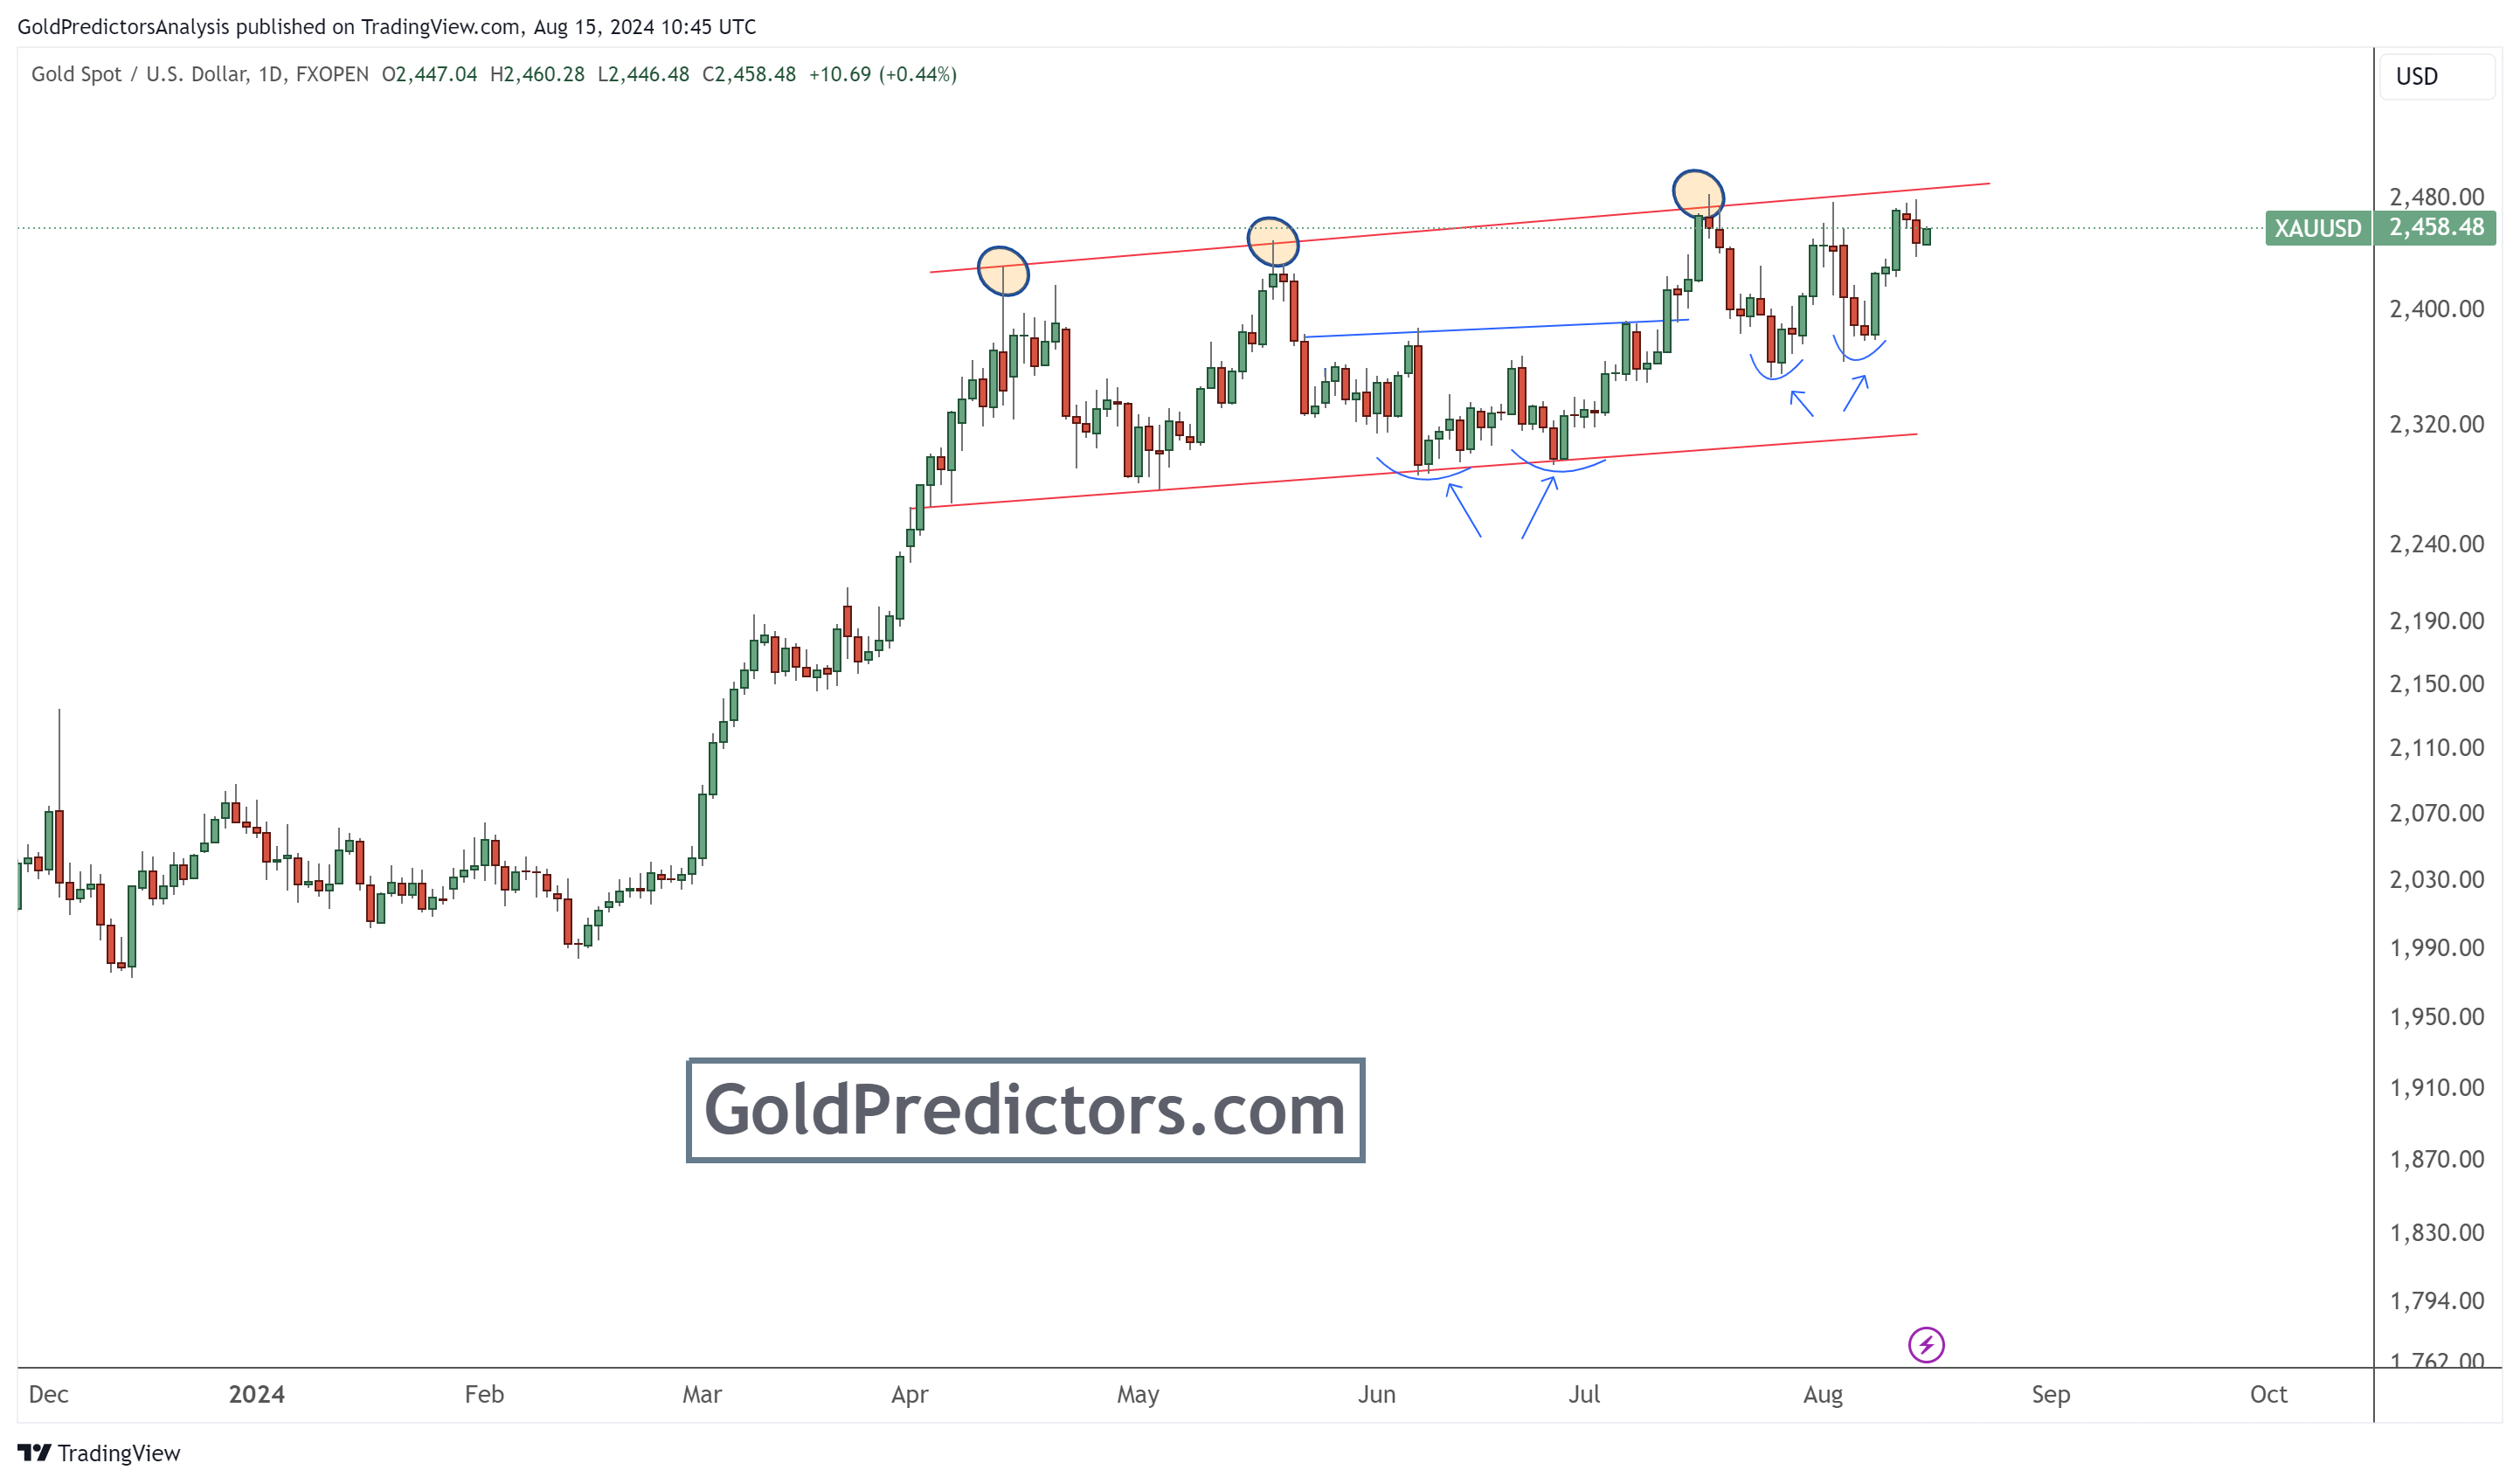
The chart also presents bullish forces in the gold market. These bullish forces are evident in the double bottom formation at the $2,287 level, which triggered a strong rally to $2,450 in July 2024. Another strong double bottom is observed around $2,350, and prices appear poised to break higher soon. A break above $2,480 could initiate a strong rally in the gold market.
Bottom line
In conclusion, the recent U.S. CPI report has not changed the gold bullish tone. While easing inflation could lead to a more cautious approach by the Federal Reserve, potentially supporting gold as a safe-haven asset, other economic factors, such as rising shelter costs and persistent super core inflation, could complicate this outlook. Despite these mixed signals, the technical chart indicates a strong potential for a bullish breakout in gold prices, particularly with the double bottom formations suggesting further upward momentum. As silver begins to lead the market, the gold-to-silver ratio's current resistance level may signal an imminent rally in gold.
Unlock exclusive gold and silver trading signals and updates that most investors don’t see. Join our free newsletter now!
Unlock exclusive gold and silver trading signals and updates that most investors don’t see. Join our free newsletter now!
Author

Muhammad Umair, PhD
Gold Predictors
Muhammad Umair is a financial markets analyst and investor who focuses on the forex and precious metals markets.


