Gold is below $1,700 again, will it repeat its fall to $1400?

The current situation of gold and its behavior in 2013 share many bearish analogies. Is the yellow metal only halfway through its massive collapse?
A decade ago
After we posted last week’s gold price forecast, gold, silver, and mining stocks declined in tune with the analysis. Is the rally over?
Let’s start by taking a closer look at gold.
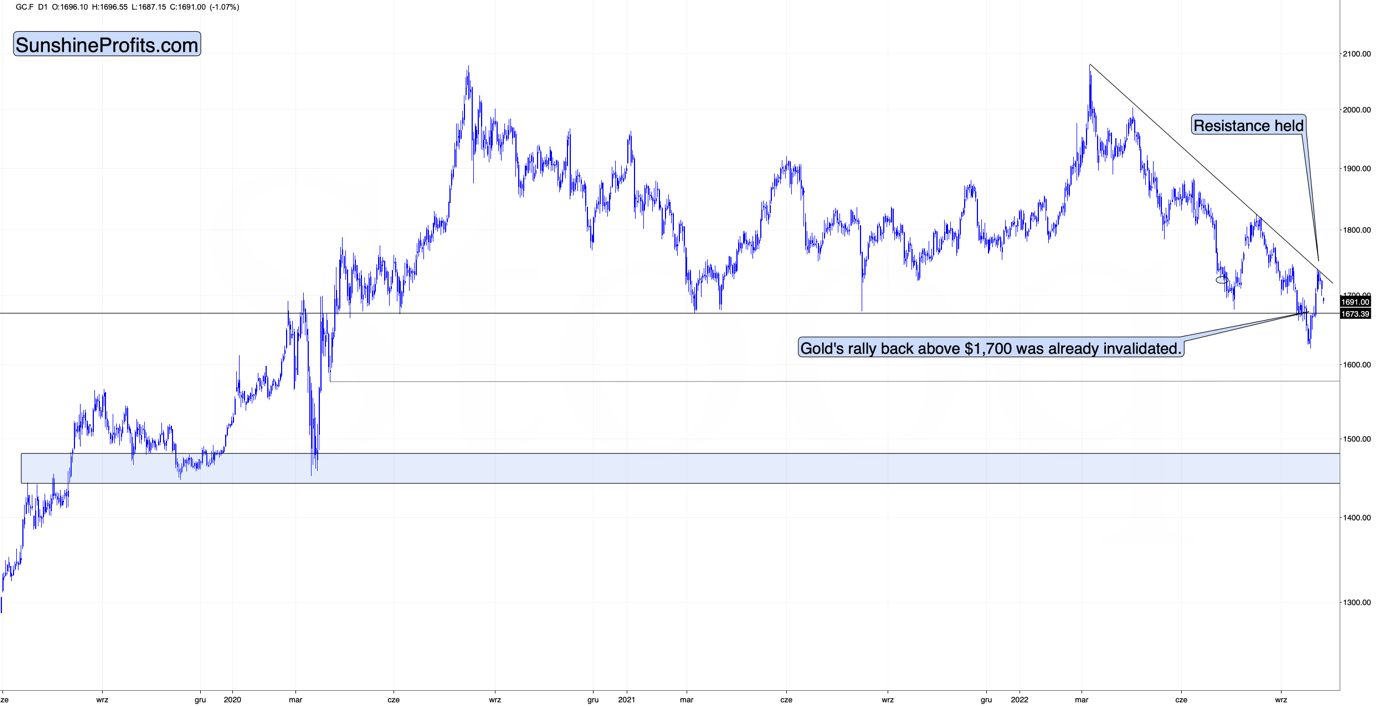
Gold declined after touching its declining, medium-term resistance line, and at the moment of writing these words it’s trading at about $1,690 – visibly below the important $1,700 level.
This means that the attempt to break above this level failed.
It’s bearish on its own, but it’s much more so when you compare the current situation to what happened in April 2013 at the analogous moment.
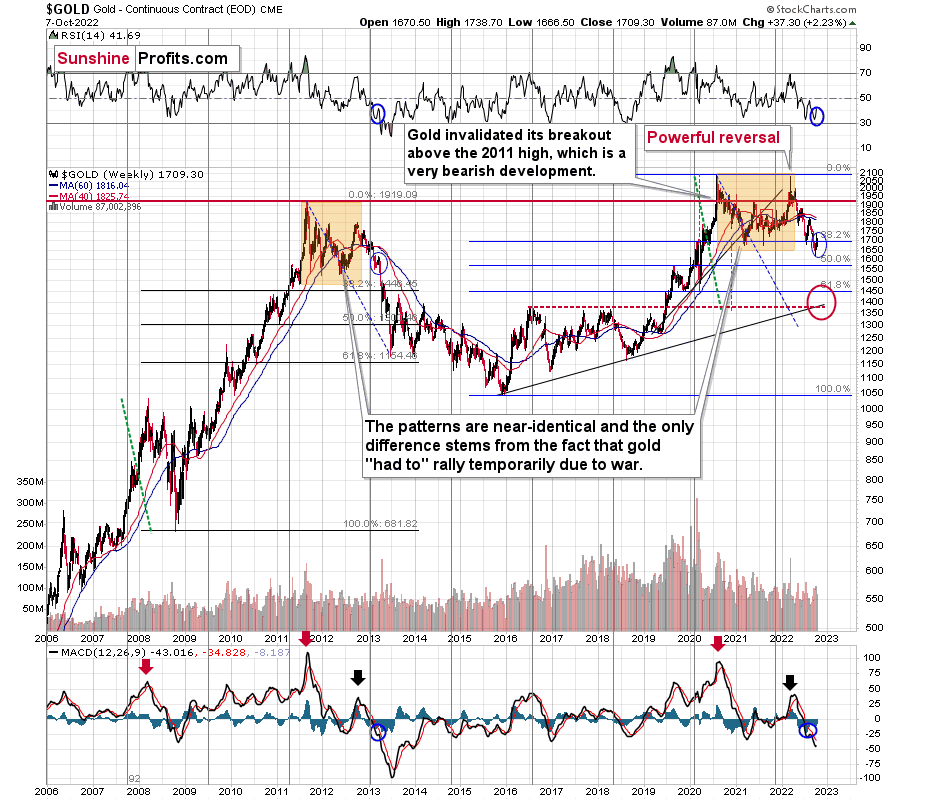
I’ve been writing about this important analogy for months, but if you haven’t read my previous analyses, please focus on the orange rectangles on the above chart – how the price behaved and what happened in the RSI and MACD indicators. The situations are near-perfectly aligned.
If you were monitoring the gold market back in April 2013, you might remember the overall feeling among gold investors and traders when gold rallied from the 2012 lows. Practically everyone and their brother were convinced that the bottom in gold is really in, and that it was about to soar to new highs.
Sort of like what we experienced recently.
Where is the line?
However, it wasn’t the bottom. It wasn’t even the mid-point of the entire medium-term decline.
Sure, history doesn’t have to repeat itself to the letter, and the geopolitical and monetary situation now is different than it was back in 2013, but… Fear and greed work in the same way, and when people try to forecast the future by looking at previous price patterns (very few people look at the big picture; most just focus on the last year or so), they ultimately follow a similar emotional process. This leads them to repeat their past behaviors and, as a result, the price patterns continue to be similar.
Actually, the situation regarding monetary policy now supports even a more profound slide than it did back in 2013. Still, due to geopolitics, the decline could be “only” similar to what we saw back then.
There’s very strong support just a bit below $1,400, and the decline to this level (approximately) would be in tune with the size of the 2011-2013 decline.
Can gold really slide that low? Absolutely.
Will it slide there immediately? There’s a good chance we’ll have some sort of correction in the meantime, and one of them might be tradable. The rebound from the 2020 lows seems quite likely at the moment, but I’ll keep monitoring the situation and report to my subscribers accordingly. I’ll also describe which part of the precious metals sector is likely to benefit the most from this decline. At this time, it seems that junior mining stocks are likely to decline the most (as they have so far this year), but this might change as prices move lower.
Either way, the short- and medium-term outlooks for gold are bearish.
Want free follow-ups to the above article and details not available to 99%+ investors? Sign up to our free newsletter today!
Want free follow-ups to the above article and details not available to 99%+ investors? Sign up to our free newsletter today!
Author

Przemyslaw Radomski, CFA
Sunshine Profits
Przemyslaw Radomski, CFA (PR) is a precious metals investor and analyst who takes advantage of the emotionality on the markets, and invites you to do the same. His company, Sunshine Profits, publishes analytical software that any


