Gold in the middle of two trend reversal patterns [Video]
![Gold in the middle of two trend reversal patterns [Video]](https://editorial.fxstreet.com/images/Markets/Commodities/Metals/Gold/gold-coins-on-a-weight-scale-gm173237086-20246712_XtraLarge.jpg)
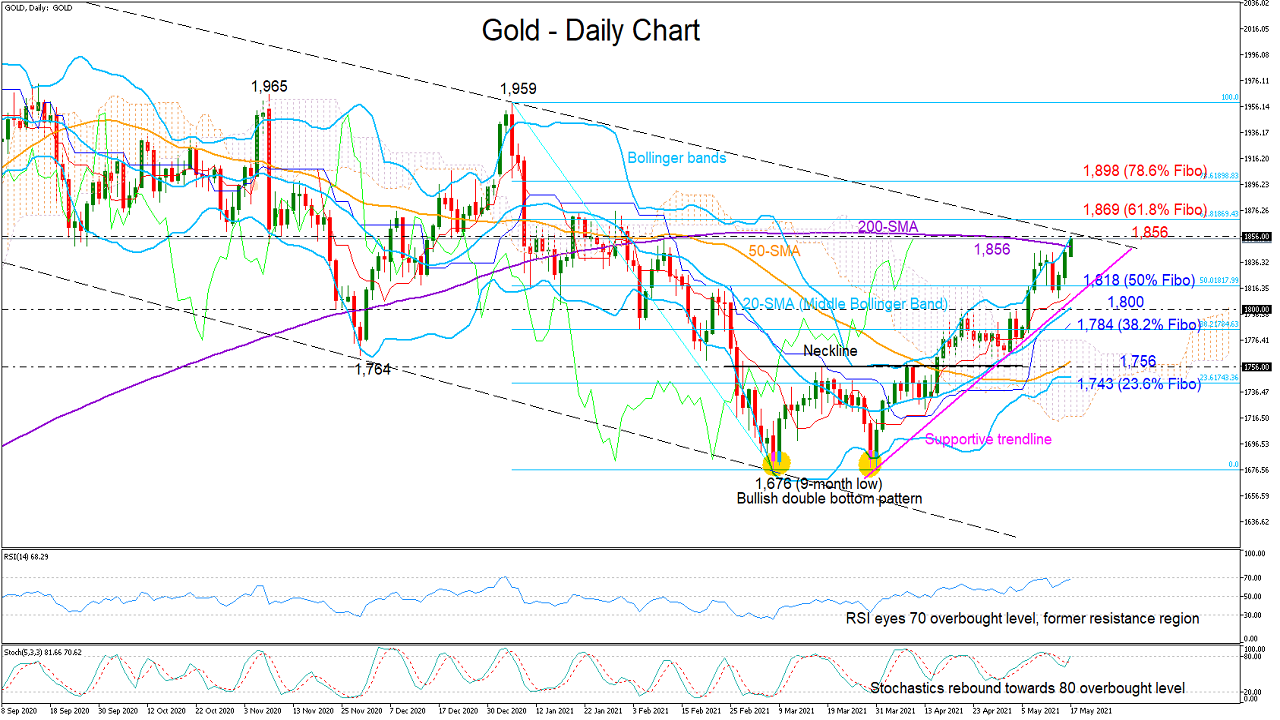
Gold has been faithfully underpinning the bullish double bottom structure since the break above the neckline of 1,756 in mid-April, making higher highs and higher lows up to a 2 ½-month high of 1,855 today.
However, whether the precious metal can stretch its short-term trend reversal pattern beyond the long-term bearish channel remains to be seen as the RSI and the Stochastics are within striking distance of their overbought levels. The price itself is trading along the upper Bollinger band for the second day, also flashing red warnings that the bears could be around the corner.
The price is currently testing the crucial resistance area of 1,847 – 1,856, formed by the 200-day simple moving average (SMA) and the channel’s upper surface. The swing high from February 10 is at the same location, adding more importance to the region. Nevertheless, a successful move above this border would not be enough to violate the long-term downtrend unless the pair shoots beyond January’s peak of 1,959. Before that, however, the 61.8% and 78.6% Fibonacci levels of the 1,959 – 1,676 downfall at 1,869 and 1,898 respectively could challenge any move higher.
In the bearish scenario, where the price slides back below the 200-day SMA, the 50% Fibonacci and the supportive trendline seen around 1,818 could come to the rescue. The 20-day SMA (middle Bollinger band) currently around 1,800 is converging towards that zone, while not far below the 38.2% Fibonacci of 1,784 may also attract attention before sellers set the stage for a more aggressive decline towards the neckline of 1,756 and the 50-day SMA.
In brief, gold seems to be at a make-or-break point near the surface of the long-term bearish channel. While any close higher would violate the downward-sloping tube, raising buying interest, an official trend reversal would be declared above 1.959 in the bigger picture. Otherwise, if the bears take control soon, the focus will fall back to 1,818.
Author

Christina joined the XM investment research department in May 2017. She holds a master degree in Economics and Business from the Erasmus University Rotterdam with a specialization in International economics.


