Gold has broken out of a symmetrical triangle

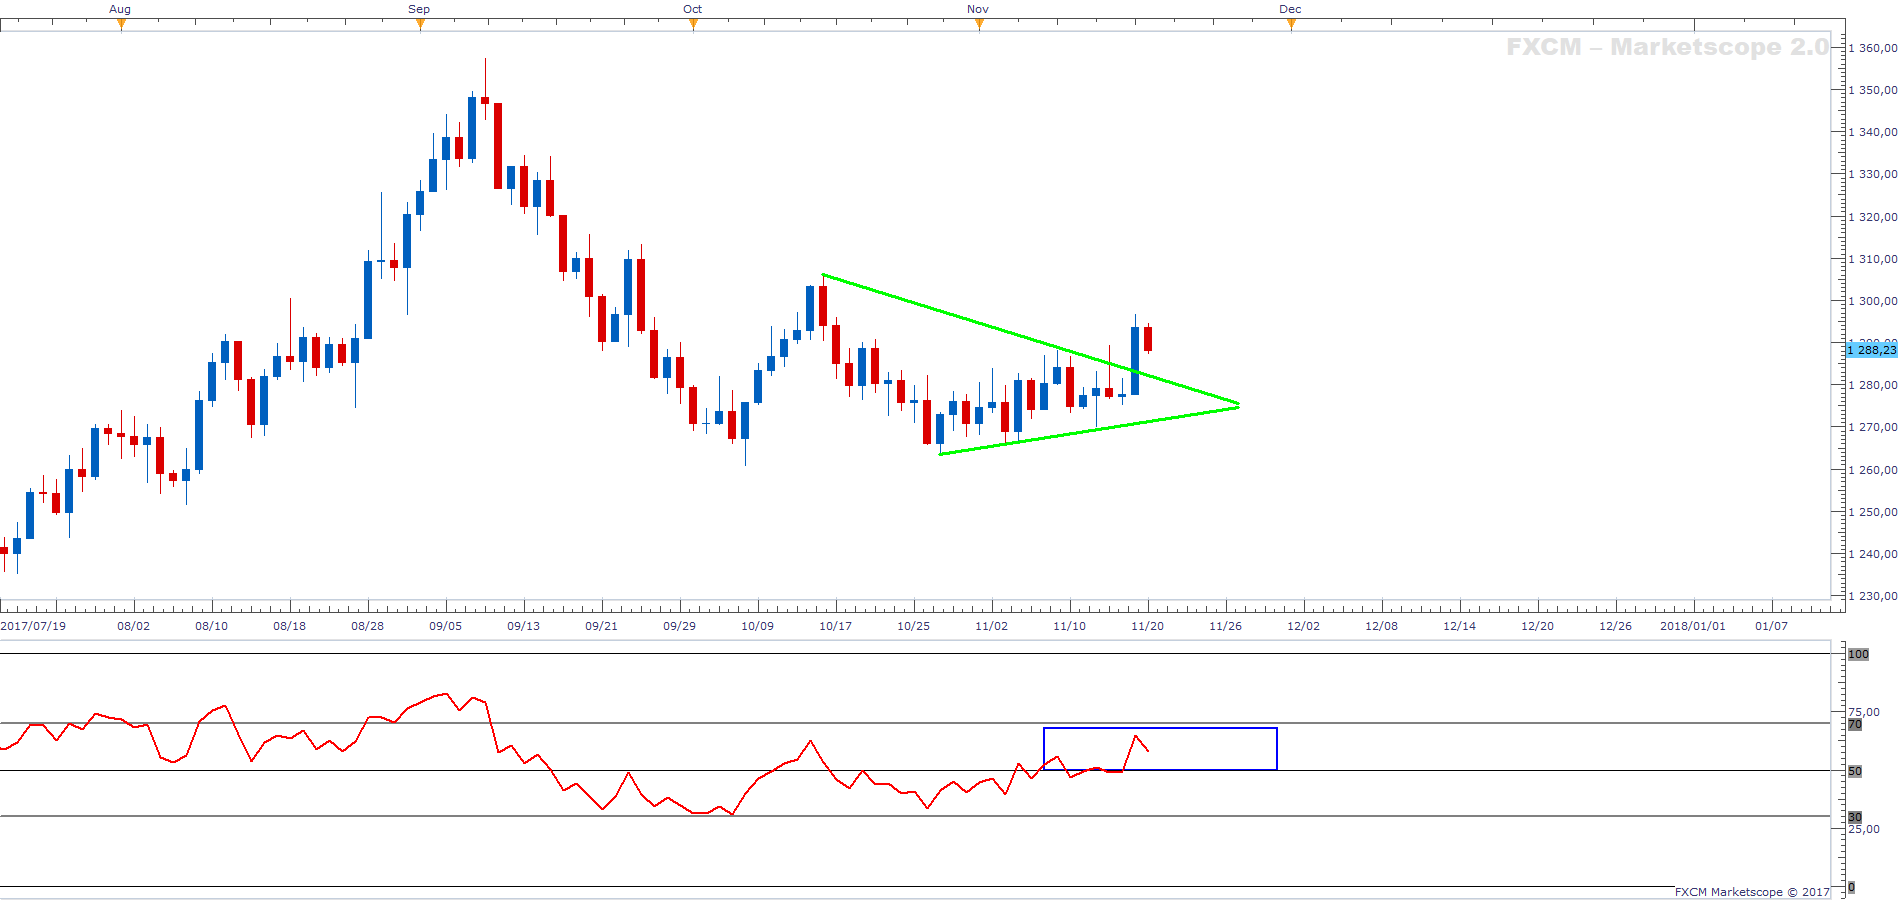
Daily
On Friday, gold broke out of a symmetrical triangle. The day was characterised by a long candle that closed only slightly off of its high. In truth, gold was threatening to break out also on Wednesday. In fact, it had broken out before the US CPI and retail prints brought the gold bears out in force, and the price closed well inside the symmetrical triangle as an inverted hammer. Nevertheless, there was no follow through on Thursday when a doji was charted and then we had the big breakout on the Friday. The RSI(9) is above 50, which does indicate a bullish bias with regards to momentum. The price retracement for today (so far) is an inside period, which does introduce an element of uncertainty. The longer the precious metal can consolidate outside and above the triangle the greater the probability that Friday's break out was the start of an impulse move northwards.
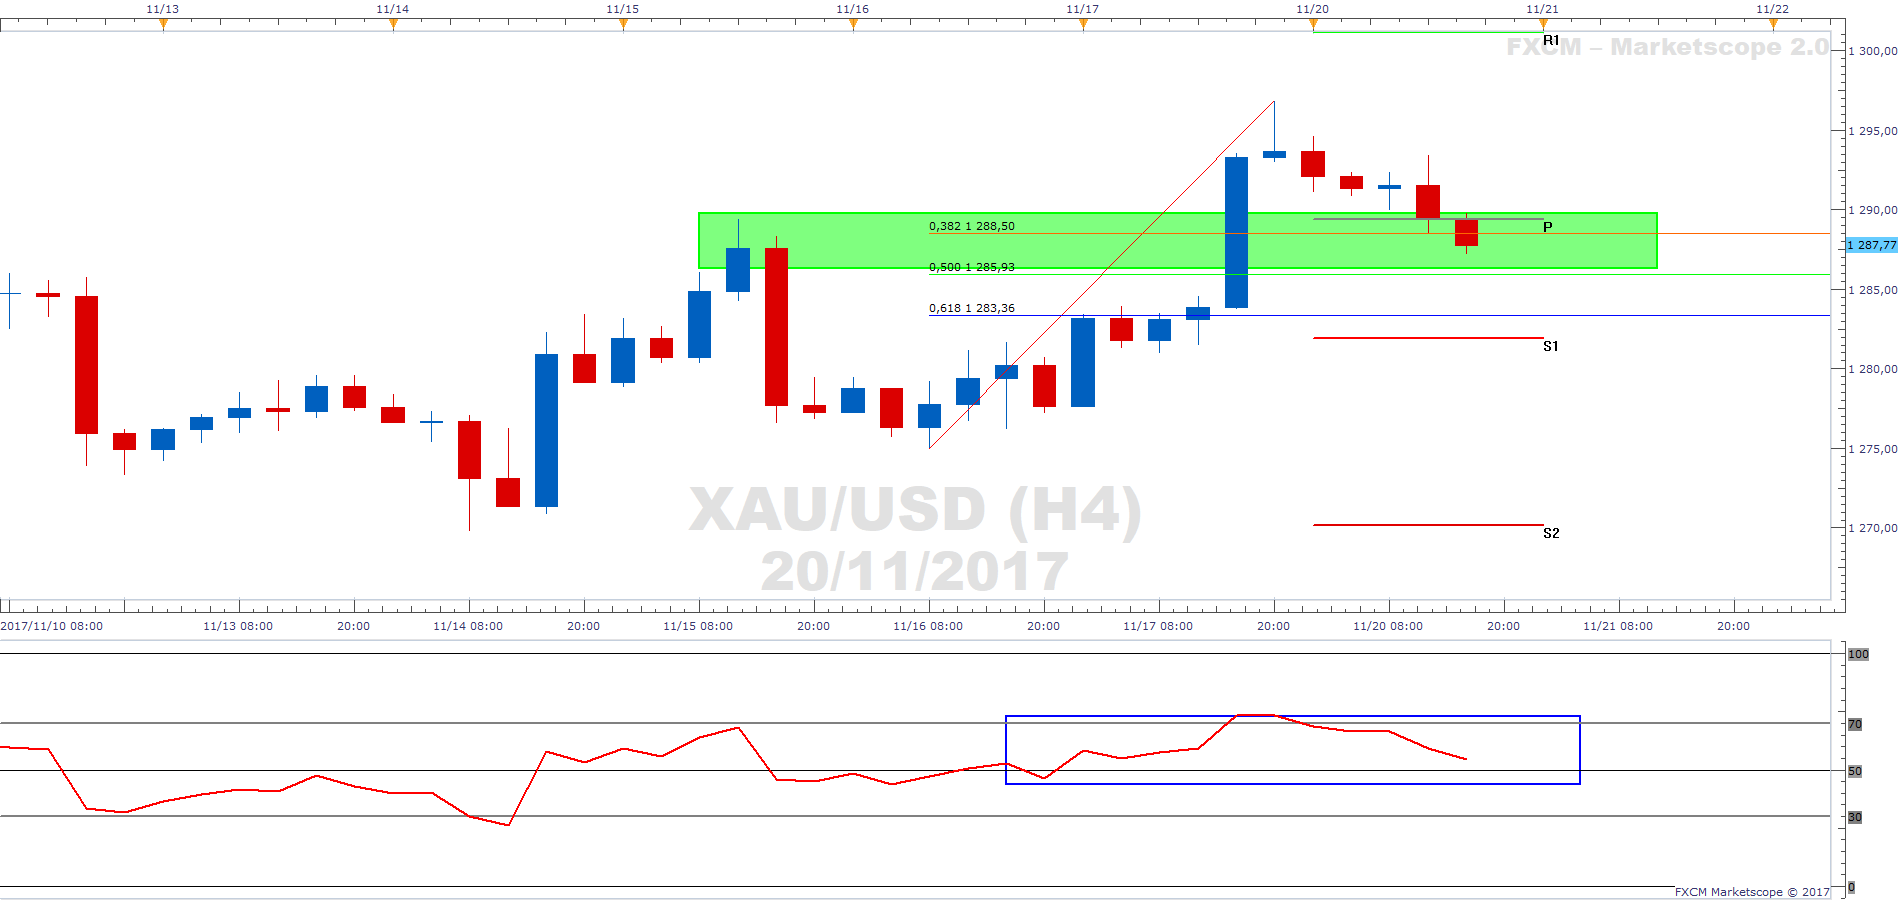
4 Hour
The 4-hour chart is enlightening. Today’s price action saw a correction to the central pivot, 38.2% Fibonacci retracement line, and resistance turned support (green shaded area). Moreover the 4 Hour RSI(9) is above 50 and indicates that a bullish bias in momentum exists. Our view is that we are likely to see further appreciation is gold based on our current assessment.
Author

Russell Shor (MSTA, CFTe, MFTA) has an Honours Degree in Economics from the University of South Africa and holds the coveted Certified Financial Technician and Master of Financial Technical Analysis qualifications from the Interna


