2015 – All about Fed lift-off
Gold is poised to end 2015 with its third-consecutive year of losses, already down 15% so far this year. The yellow metal extended its downward trajectory, with markets adopting the ‘Sell on Rallies’ strategy almost through 2015 expectant of the US Federal Reserve’s (Fed) efforts towards policy normalization and thus, end an era of low-interest rate regime.Gold prices peaked around $ 1307/ oz in January this year after the Swiss National Bank abandoned the Swiss franc-euro peg and the European Central Bank (ECB) announced a full-blown QE program in a bid to combat lower growth and inflation in the Euroland. Subsequently, the bullion fell to $ 1150 by the end of the first quarter, only to consolidate the previous drop in Q2 before the next leg lower. The yellow metal found some support from Greece default issues during the June quarter, although failed to sustain the recovery and eventually fell to $ 1080 in July on increased bets of a Fed rate hike in September. However, the recovery picked-up pace in the Q3 as the Chinese yuan devaluation shocker boosted the safe-haven bids for gold against the backdrop of China-led uncertainties and the resulting global equities sell-off. While the surprisingly dovish Fed at its Sept FOMC meeting poured cold-water on expectations of a rate lift-off in 2015, also lending support to the non-interest bearing gold.
Heading into the crucial Q4, the recovery lost steam just below 1190 levels and the prices dropped sharply after the stellar US jobs report in the last two months of the year, which suggested solid improvement in the US labor market and sealed in a Dec Fed rate rise deal. The spot price dropped to the lowest levels since Feb 2010 at $ 1046.10 on Dec 3 in anticipation of a Fed lift-off and on the back of an unusually hawkish ECB decision. And, finally the historic Fed rate hike was announced on Dec 16, with the US central bank raising the target range for the Fed funds rate by 25bps to 0.25%-0.50% for the first time in more than nine years. Gold prices now attempt a minor-recovery from multi-year lows and trade around $ 1070 post-FOMC as the US dollar still remains underpinned on the back of year-end flows.
2016 – A year of two halves for gold
Heading towards 2016, gold prices hover near five-year lows as the Fed rate hike outlook is expected to remain the key theme next year. The Fed’s Dots chart pointed towards four hikes in 2016, accounting for 100 bps rise in the interest rates. While out of the US, most other global central banks are looking to extend their ultra-loose monetary policy and resort to further currency debasement in order to spur economic growth and remain competitive, which could emerge gold supportive.Hence, the year ahead for gold appears to be split into two halves, with the first half dominated by further US rate increases and resulting USD strength weighing on the bullion. While in the H2 2016, gold prices could see a solid recovery on the back of pick-up in demand and amid a world of cheap central bank liquidity.
H1 2016: Gold could see a bottom around $ 900 on account of the following reasons:
- Fed extends its interest rate tightening campaign well into 2016, with the ‘gradual rate increases’ seen at its March and June FOMC meetings. Both meetings are associated with a Summary of Economic projections (SEP) and a press conference by the Chair J.Yellen.
- The US dollar keeps strengthening on the back of central banks’ divergent monetary policy outlooks and improving US economic prospects.
- Ongoing weakness in industrial metals and oil prices exposes further downside risks.
- Gold charts/ technical outlook points to a clear downtrend targeting $ 900 levels.
- Sharp USD appreciation to have disinflationary effects and hurt the US economy, which is actually not growing as fast as official figures suggest.
- As a result, the Fed could be forced to restrict rate hikes by only two quarter percent rises before mid-2016 and perhaps even launch a form of QE4 in the latter half to revive the stalling economic recovery in the US.
- Bargain-hunting at lower levels from price sensitive Asian markets such as India and China. According to the World Gold Council (WGC) report, more than 90% of physical gold demand comes primarily from Asian economies – particularly China and India.
- Rise in demand for gold as a hedge on increased exposure towards risk assets as investors search for higher returns amid persisting low yield environment. The stock valuations in the US and across the globe remain elevated and pose significant risk to markets, which is likely to boost gold on the back of flight to safety.
- Analysts expect the Euro zone recovery to gain further momentum as the QE program continues to have intended effects on the growth and inflation outlook. Hence, a stronger euro against the greenback could also push gold prices higher towards $ 1200 by end of next year.
- Among other economies, Japan and China are also expected to keep monetary and fiscal policy accommodative in 2016, which could aid the recovery in the gold prices.
- Central bank purchases, especially from emerging markets, are expected to remain at historically high levels in 2016. Central bank purchases this year are seen stronger at around 450,000 tonnes.
Gold Technicals: Watch out for a reversal from cluster support
Monthly Chart

Gold witnessed a bearish break from the falling wedge formation in July 2015, and subsequently fell as low as $ 1076.77. The prices bottomed at the last and attempted a recovery towards 1200 levels, before having faltered at $ 1191.53. Gold resumed its downward momentum thereon and dropped to fresh five-year lows near $ 1050, with the pattern target at around $ 900, still in sight.
As observed in the above chart, a strong cluster support lies between $ 885-$ 945 zone, where the long-term downside channel support, Fib confluence (1999-2011 parabolic rise & Oct 2008-Sept 2011 rally) and the falling wedge target coincide. Hence, this confluence zone is expected to emerge a key reversal point in 2016. A failure to resist the last, the prices could drop sharply to the next support at $ 700, personally which doesn’t seem likely going forward.
If the yellow metal manages to hold the key cluster support, we could see a sharp rise in the prices back towards 1085 levels, where the Fib 50% support-turned resistance (blue retracement from 1999 to all-time high in 2011) would act as a strong barrier. A break above which the prices could head higher for a test of $ 1150/1154 – psychological levels and also the key Fib 61.80% retracement of Oct 2008- Sept 2011 rally. Further upside from here is seen at the falling wedge resistance (light blue line) located at $ 1235. Bulls will make solid attempt towards 2015 highs reached ahead of 1300 mark, on a breach of 1235 levels.
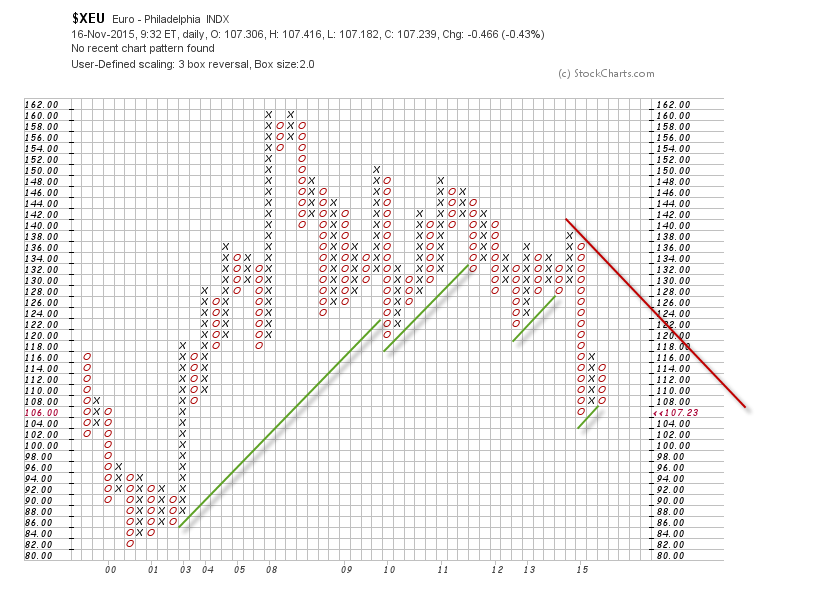
Gold Point & Figure Charts Forecast by Gonçalo Moreira, CMT
As portrayed in the 3-box reversal chart below, the trend for spot gold price comes dictated by a bearish 45º line. This market has remained in a bearish tone since the 1920.00 major high established back in 2011 and since then the few attempts to build a bullish 45º line have been of short duration.
We can regard this bearish development as a temporary reaction within a secular bull market trend. From this long-term perspective, only an annual closing below the lows of 680.00 -the price where the impressive 2009-2011 bull run emerged- would signal a change in the long-term trend.
860.00 U.S. dollar per ounce is one of the vertical counts 3-box charts can offer right now, well below the 680.00 support and therefore achievable. The caveat in this count is the long time it took to be activated which accordingly to P&F charting should happen within the same pattern. As a side note, the 200-month SMA on the regular charts is right now at 820.00 and ascending, ready to act as barrier in a downward acceleration.
The next vertical count, established at the beginning of 2013 and activated the same year in June, targets 540.00. As long as the 45º line is not violated I would not rule out a crash-like spike to that level with a yearly close already above.
The short-term view, still on the same chart is bearish despite current rally attempts. A break of the 1190 with a double-top breakout would be the only threat to the trend line and signal to cut shorts.
The 1-box reversal point and figurechart reveals nearly the same target level at 850.00 from thehorizontal count formed during the 2011/12 topping formation.
Currencies
EUR USD Forecast 2016
GBP USD Forecast 2016
USD JPY Forecast 2016
Central Banks
ECB Forecast 2016
RBA Forecast 2016
PBoC Forecast 2016
FED Forecast 2016
BoE Forecast 2016
BoJ Forecast 2016
SNB Forecast 2016
Commodities
Gold Forecast 2016
Information on these pages contains forward-looking statements that involve risks and uncertainties. Markets and instruments profiled on this page are for informational purposes only and should not in any way come across as a recommendation to buy or sell in these assets. You should do your own thorough research before making any investment decisions. FXStreet does not in any way guarantee that this information is free from mistakes, errors, or material misstatements. It also does not guarantee that this information is of a timely nature. Investing in Open Markets involves a great deal of risk, including the loss of all or a portion of your investment, as well as emotional distress. All risks, losses and costs associated with investing, including total loss of principal, are your responsibility. The views and opinions expressed in this article are those of the authors and do not necessarily reflect the official policy or position of FXStreet nor its advertisers. The author will not be held responsible for information that is found at the end of links posted on this page.
If not otherwise explicitly mentioned in the body of the article, at the time of writing, the author has no position in any stock mentioned in this article and no business relationship with any company mentioned. The author has not received compensation for writing this article, other than from FXStreet.
FXStreet and the author do not provide personalized recommendations. The author makes no representations as to the accuracy, completeness, or suitability of this information. FXStreet and the author will not be liable for any errors, omissions or any losses, injuries or damages arising from this information and its display or use. Errors and omissions excepted.
The author and FXStreet are not registered investment advisors and nothing in this article is intended to be investment advice.
Recommended Content
Editors’ Picks
EUR/USD stays in positive territory above 1.0850 after US data

EUR/USD clings to modest daily gains above 1.0850 in the second half of the day on Friday. The improving risk mood makes it difficult for the US Dollar to hold its ground after PCE inflation data, helping the pair edge higher ahead of the weekend.
GBP/USD stabilizes above 1.2850 as risk mood improves

GBP/USD maintains recovery momentum and fluctuates above 1.2850 in the American session on Friday. The positive shift seen in risk mood doesn't allow the US Dollar to preserve its strength and supports the pair.
Gold rebounds above $2,380 as US yields stretch lower

Following a quiet European session, Gold gathers bullish momentum and trades decisively higher on the day above $2,380. The benchmark 10-year US Treasury bond yield loses more than 1% on the day after US PCE inflation data, fuelling XAU/USD's upside.
Avalanche price sets for a rally following retest of key support level

Avalanche (AVAX) price bounced off the $26.34 support level to trade at $27.95 as of Friday. Growing on-chain development activity indicates a potential bullish move in the coming days.
The election, Trump's Dollar policy, and the future of the Yen

After an assassination attempt on former President Donald Trump and drop out of President Biden, Kamala Harris has been endorsed as the Democratic candidate to compete against Trump in the upcoming November US presidential election.