Gold Elliott Wave analysis
Gold has broken into a new record high to confirm the ending of the previous pullback and the continuation of the long-term bullish trend. In the short and medium term, the upside remains favored from pullbacks. Meanwhile, the current bullish cycle started in September 2022. based on this Elliott wave analysis, it appears this cycle is in the last leg. However, this previous leg could still extend toward 2900 or even higher.
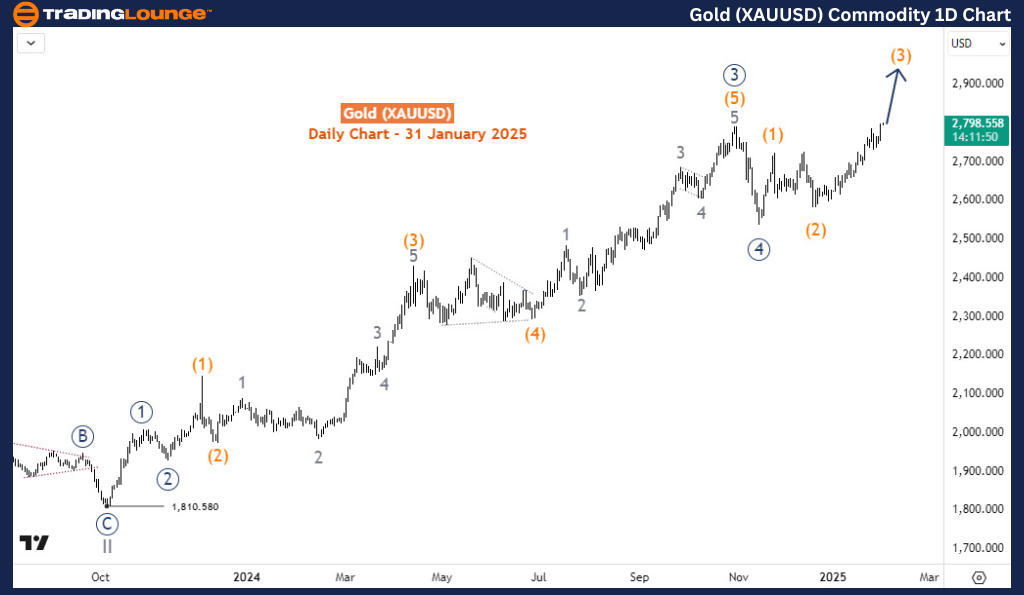
Daily chart analysis
The daily chart captured the bullish cycle from 1,810 at the low of September 2022. At the low of September 2022, wave II finished and wave II started. Along this cycle price has evolved with an impulse 5-wave structure as expected for a 3rd wave. It appears the price has completed waves ((1))-((4)) of III and is now progressing in wave ((5)) from the low of November 2024. With the break of the wave ((3)) high, we can now confirm the wave (3) of ((5)). With (3) could extend toward 2900. Thus, there can still be good opportunities for buyers from the dip in the hourly charts.
Four-hour chart analysis
Wave (3) is still developing and the wave count can change as we have a series of 1-2-1-2 evolving. This is an early sign of an extended third. For now, we can take the rally from the 2689 low as the starting point for ((iii)) of 1 of (3) or already 3 of (3). However, one thing is clear - the upside should continue amid the varying possible counts.
Gold Elliott Wave technical analysis [Video]
As with any investment opportunity there is a risk of making losses on investments that Trading Lounge expresses opinions on.
Historical results are no guarantee of future returns. Some investments are inherently riskier than others. At worst, you could lose your entire investment. TradingLounge™ uses a range of technical analysis tools, software and basic fundamental analysis as well as economic forecasts aimed at minimizing the potential for loss.
The advice we provide through our TradingLounge™ websites and our TradingLounge™ Membership has been prepared without considering your objectives, financial situation or needs. Reliance on such advice, information or data is at your own risk. The decision to trade and the method of trading is for you alone to decide. This information is of a general nature only, so you should, before acting upon any of the information or advice provided by us, consider the appropriateness of the advice considering your own objectives, financial situation or needs. Therefore, you should consult your financial advisor or accountant to determine whether trading in securities and derivatives products is appropriate for you considering your financial circumstances.
Recommended Content
Editors’ Picks
AUD/USD stays vulnerable toward 0.6200 ahead of US PCE data
AUD/USD sits at monthly lows, eyeing 0.6200 early Friday. Traders remain risk averse amid US tariff threats, underpinning the safe-haven US Dollar and dragging the pair lower. All eyes now remain on the US PCE inflation data for fresh trading impulse.
USD/JPY holds sizeable losses near 149.50 amid risk aversion
USD/JPY remains under intense selling pressure to trades near 149.50 in Friday's Asian trading. Despite dismal Tokyo CPI and Japan's Retail Trade data, the Japanese Yen stands resilient due to risk aversion. The US Treasury bond yields sell-off weighs heavily on the pair ahead of US PCE data.
Gold breaches key $2,890 support ahead of US PCE inflation data
Gold price struggles near two-week lows below $2,900 in Friday’s Asian trading hours, looking to snap its eight consecutive weekly gains. Traders weigh the latest tariff threats from US President Donald Trump and the sharp decline in the American artificial intelligence leader Nvidia's share price.
Ripple's XRP sees further decline as short-term holders take profits, whales buy the dip
Ripple's XRP is down 4% on Thursday as it struggles near the support at $2.12. Whales have been accumulating the recent selling pressure from short-term holders following the recent crypto market crash.
February inflation: Sharp drop expected in France, stability in the rest of the Eurozone
Inflation has probably eased in February, particularly in France due to the marked cut in the regulated electricity price. However, this overall movement masks divergent trends. Although disinflation is becoming more widespread, prices continue to rise rapidly in services, in France as well as elsewhere in the Eurozone.
The Best brokers to trade EUR/USD
SPONSORED Discover the top brokers for trading EUR/USD in 2025. Our list features brokers with competitive spreads, fast execution, and powerful platforms. Whether you're a beginner or an expert, find the right partner to navigate the dynamic Forex market.