Gold Elliott Wave technical analysis [Video]
![Gold Elliott Wave technical analysis [Video]](https://editorial.fxstreet.com/images/Markets/Commodities/Metals/Gold/raw-gold-55156544_XtraLarge.jpg)
Gold Elliott Wave analysis
Gold is still within the bearish correction that started in late October when it reached a fresh record high. After hitting 2530 in November 2024, the commodity bounced sharply and then went sideways. However, from the Elliott wave perspective, it appears the bearish corrective cycle from late October will extend lower especially if the commodity breaches 2582 (December low).
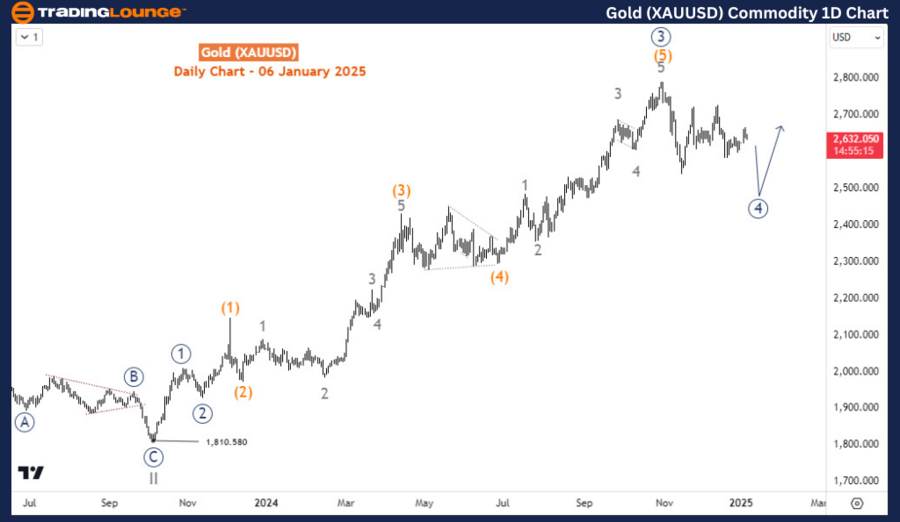
Gold daily chart analysis
On the daily chart, the trend remains bullish as wave III emerges from 1810 (October 2023 low). Wave III is incomplete yet which means buyers can continue to take long positions from the dip. The current dip from late October 2024 is expected to be wave ((4)) of III. This means there may be one more rally for the larger bullish cycle from September 2022 ($1616) before the price begins a larger correction for the entire cycle. In that case, being a 4th wave, the current pullback should be shallow. Structurally, wave ((4)) appears to be emerging as a double zigzag pattern at the moment. Alternatively, it could be a triangle if prices remain fixed between 1725 and 2538 in the next few weeks.
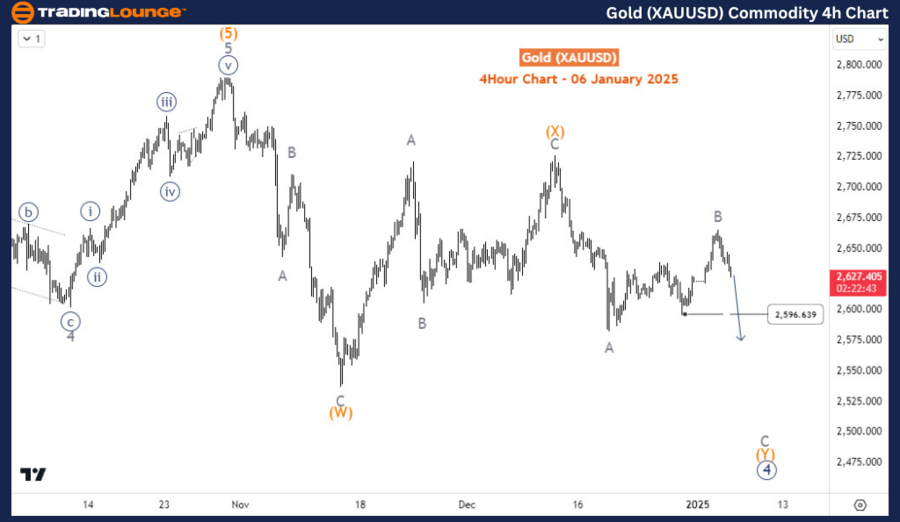
Gold four-hour chart analysis
The H4 chart prepares for a double zigzag structure for wave ((4)). if this plays out, the price should extend lower in wave C of (Y) below 2580 and 2538 toward 2477-2334 where it may finish wave ((4)) and find fresh bids needed to begin wave ((5)) toward a fresh record high.
Gold Elliott Wave technical analysis [Video]
Author

Peter Mathers
TradingLounge
Peter Mathers started actively trading in 1982. He began his career at Hoei and Shoin, a Japanese futures trading company.


