|

Gold Elliott Wave technical analysis [Video]

Gold Elliott Wave analysis

Gold is about 9% from its record high in late October. Despite the sell-off, the bias remains bullish from a medium—and long-term perspective. However, despite the expectation that the commodity will return to the upside to continue the bullish trend, the current pullback from October will likely extend lower.

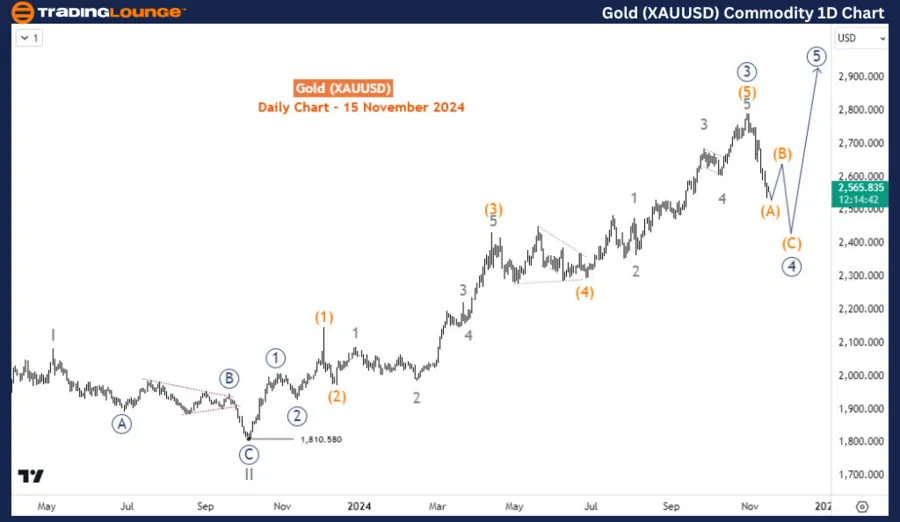
Daily chart analysis

From the long-term Elliott wave perspective, price appears to be correcting the bullish cycle that started in October 2023 when Gold was exchanged for 1810. After completing wave (IV) of the supercycle degree in September 2022, Gold rallied to complete waves I and II of (V) in May 2023 and October 2023 respectively. Thus wave III of (V) started in October 2023 at 1810. However, it appears wave III has not finished yet. The current pullback is expected to either be in wave ((4)) of III already or wave (4) of ((3)) of III. The most important task now is to note what structure is unfolding from the late October peak.

Chart

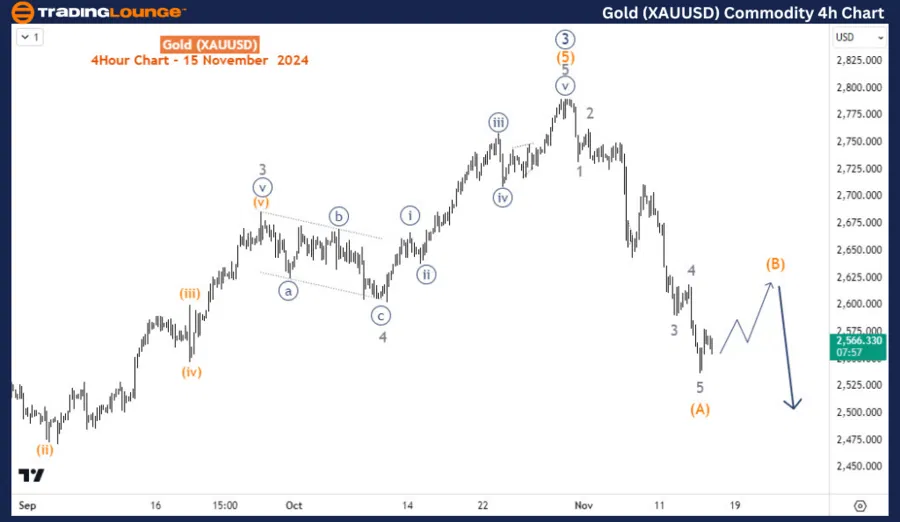
Four-hour chart analysis

On the H4 Chart, the price is currently in the last stage of wave (A). A corrective bounce for wave (B) should follow before further decline in wave (C) which could extend toward 2400 or lower depending on the height of wave (B).

Gold

Gold Elliott Wave technical analysis [Video]

Author

Peter Mathers

Peter Mathers

TradingLounge

Peter Mathers started actively trading in 1982. He began his career at Hoei and Shoin, a Japanese futures trading company.

More from Peter Mathers
Share:

Editor's Picks

EUR/USD hits two-day highs near 1.1820

EUR/USD picks up pace and reaches two-day tops around 1.1820 at the end of the week. The pair’s move higher comes on the back of renewed weakness in the US Dollar amid growing talk that the Fed could deliver an interest rate cut as early as March. On the docket, the flash US Consumer Sentiment improves to 57.3 in February.

GBP/USD reclaims 1.3600 and above

GBP/USD reverses two straight days of losses, surpassing the key 1.3600 yardstick on Friday. Cable’s rebound comes as the Greenback slips away from two-week highs in response to some profit-taking mood and speculation of Fed rate cuts. In addition, hawkish comments from the BoE’s Pill are also collaborating with the quid’s improvement.

Gold climbs further, focus is back to 45,000

Gold regains upside traction and surpasses the $4,900 mark per troy ounce at the end of the week, shifting its attention to the critical $5,000 region. The move reflects a shift in risk sentiment, driving flows back towards traditional safe haven assets and supporting the yellow metal.

Crypto Today: Bitcoin, Ethereum, XRP rebound amid risk-off, $2.6 billion liquidation wave

Bitcoin edges up above $65,000 at the time of writing on Friday, as dust from the recent macro-triggered sell-off settles. The leading altcoin, Ethereum, hovers above $1,900, but resistance at $2,000 caps the upside. Meanwhile, Ripple has recorded the largest intraday jump among the three assets, up over 10% to $1.35.

Three scenarios for Japanese Yen ahead of snap election

The latest polls point to a dominant win for the ruling bloc at the upcoming Japanese snap election. The larger Sanae Takaichi’s mandate, the more investors fear faster implementation of tax cuts and spending plans. 

XRP rally extends as modest ETF inflows support recovery

Ripple is accelerating its recovery, trading above $1.36 at the time of writing on Friday, as investors adjust their positions following a turbulent week in the broader crypto market. The remittance token is up over 21% from its intraday low of $1.12.