Gold Elliott Wave analysis [Video]
![Gold Elliott Wave analysis [Video]](https://editorial.fxstreet.com/images/Markets/Commodities/Metals/Gold/gold-gm187363896-28836378_XtraLarge.jpg)
Gold Elliott Wave analysis
Function - Trend.
Mode - Impulse.
Structure - Impulse wave.
Position -Wave A of (4).
Direction - Wave A of (4) is still in progress.
Details - 1st Scenario - Gold now favors the current dip to continue as part of wave (4) in a zigzag structure.
2nd Scenario - It may be wave 4 turning into an expanding flat with a dip below the current wave 4 low. If after the current bearish impulse below wave 4 low, the price reacts with a bullish impulse, then this scenario will be favored.
The 1st scenario will be preferred if the next rally is corrective. The 1st has a lower price forecast than the 2nd.
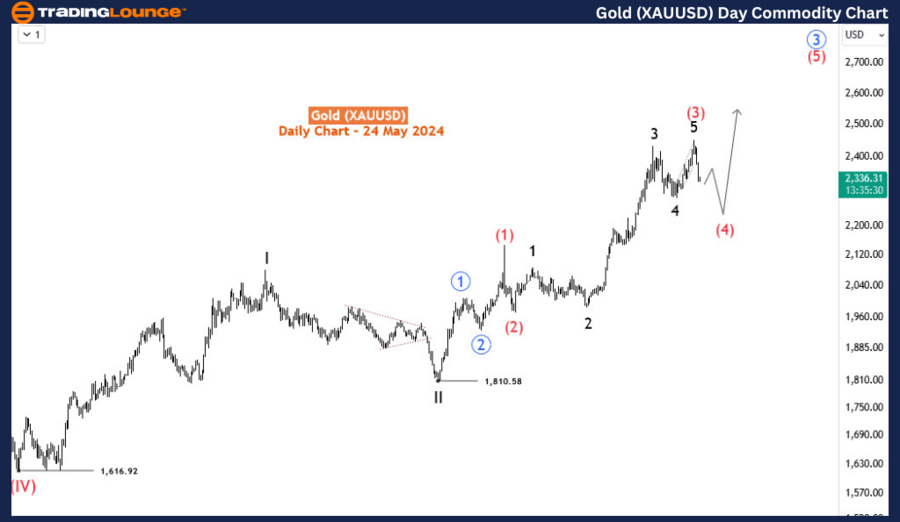
Gold is currently experiencing a pullback from a fresh all-time high. However, the year-long and all-time bullish cycle remains intact. Buyers will therefore look for the next opportunity to buy the dip, anticipating that the uptrend will continue. Identifying when the dip is over is crucial. This blog post aims to analyze that.
On the daily timeframe, the current bullish impulse trend emerged from the 1616 low of September 2022, marking the start of the supercycle degree 4th wave of a multi-decade impulse wave. Consequently, the supercycle 5th wave is far from completion as it has not even yet completed the 3rd sub-wave of its 3rd sub-wave, i.e., intermediate wave (3) of primary wave 3 (circled in blue). The current pullback is expected to be wave (4) of the primary degree.
On the H4 chart, wave (4) is completing its first wave—wave A—as an impulse. It is expected to correct upwards in wave B before dropping further to form a zigzag, at least into the 38.2-50% retracement zone at 2256-2199. After wave (4), the price could ascend again in wave (5). However, there can be alternative scenarios that may unfold. The best among them is a running flat structure for wave 4 of (3). The current impulse could complete a 3-3-5 structure for wave 4 below its current low if the response afterward is a bullish impulse.
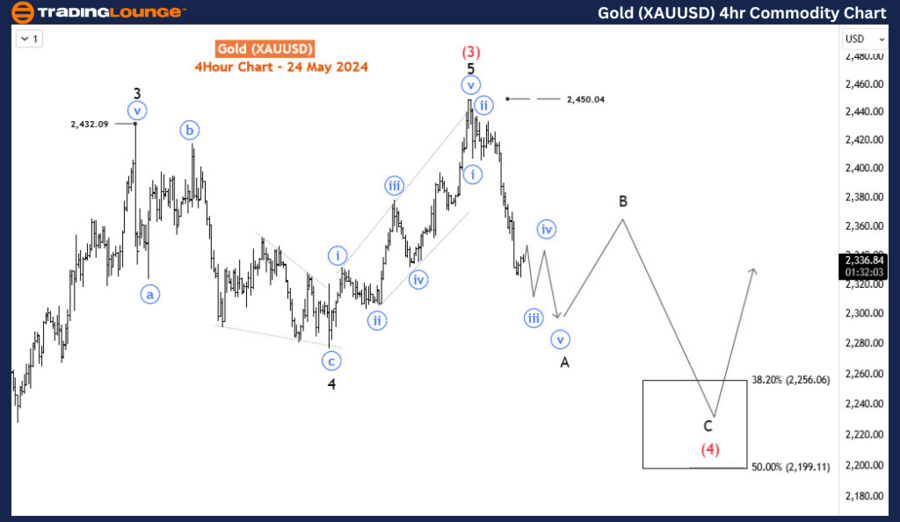
In summary, gold is in a pullback that could reach 2256-2199 before resuming its upward movement to continue the all-time bullish cycle to a new high.
Gold Elliott Wave analysis [Video]
Author

Peter Mathers
TradingLounge
Peter Mathers started actively trading in 1982. He began his career at Hoei and Shoin, a Japanese futures trading company.


