|

Gold continuing to find support into the pullbacks

In this technical blog, we will look at the past performance of the 1-hour Elliott Wave charts of the Gold. The rally from the 25 July 2024 low showed a higher high sequence & provided a short-term extreme trading opportunity. In this case, the pullback managed to reach the equal legs area and provided a perfect reaction higher. So, we advised not to sell Gold but to buy the equal legs area for a minimum reaction higher to happen. We will explain the structure and forecast below:

Gold one-hour Elliott Wave chart from 8.22.2024

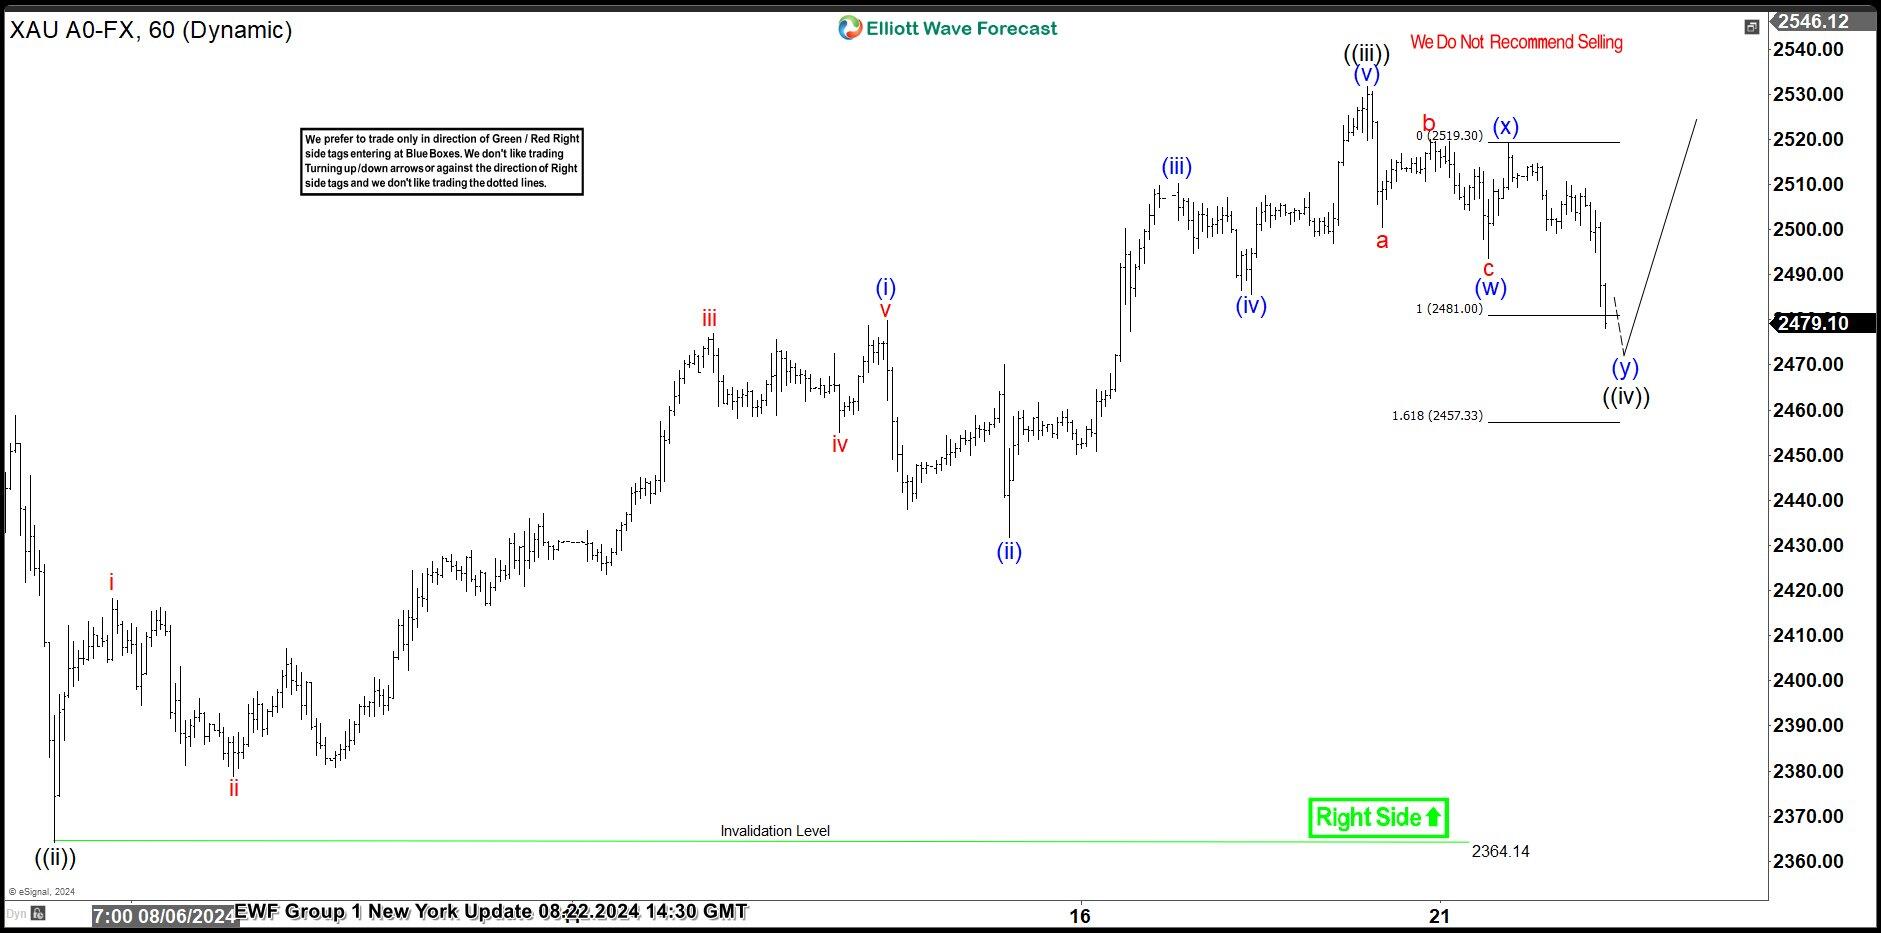
Here’s the one-hour Elliott wave chart from the 08/22/2024 NY update. In which, the rally to $2531.67 high ended wave ((iii)) & made a pullback in wave ((iv)). The internals of that pullback unfolded as Elliott wave double three structure where wave (w) ended at $2493.70 low. Then a short-term bounce to $2519.11 high-ended wave (x) & started the next leg lower in wave (y) towards $2481- $2457 equal legs area. From there, buyers were expected to appear looking for new highs ideally or for a 3-wave bounce minimum.

Gold latest one-hour Elliott Wave chart from 8.26.2024

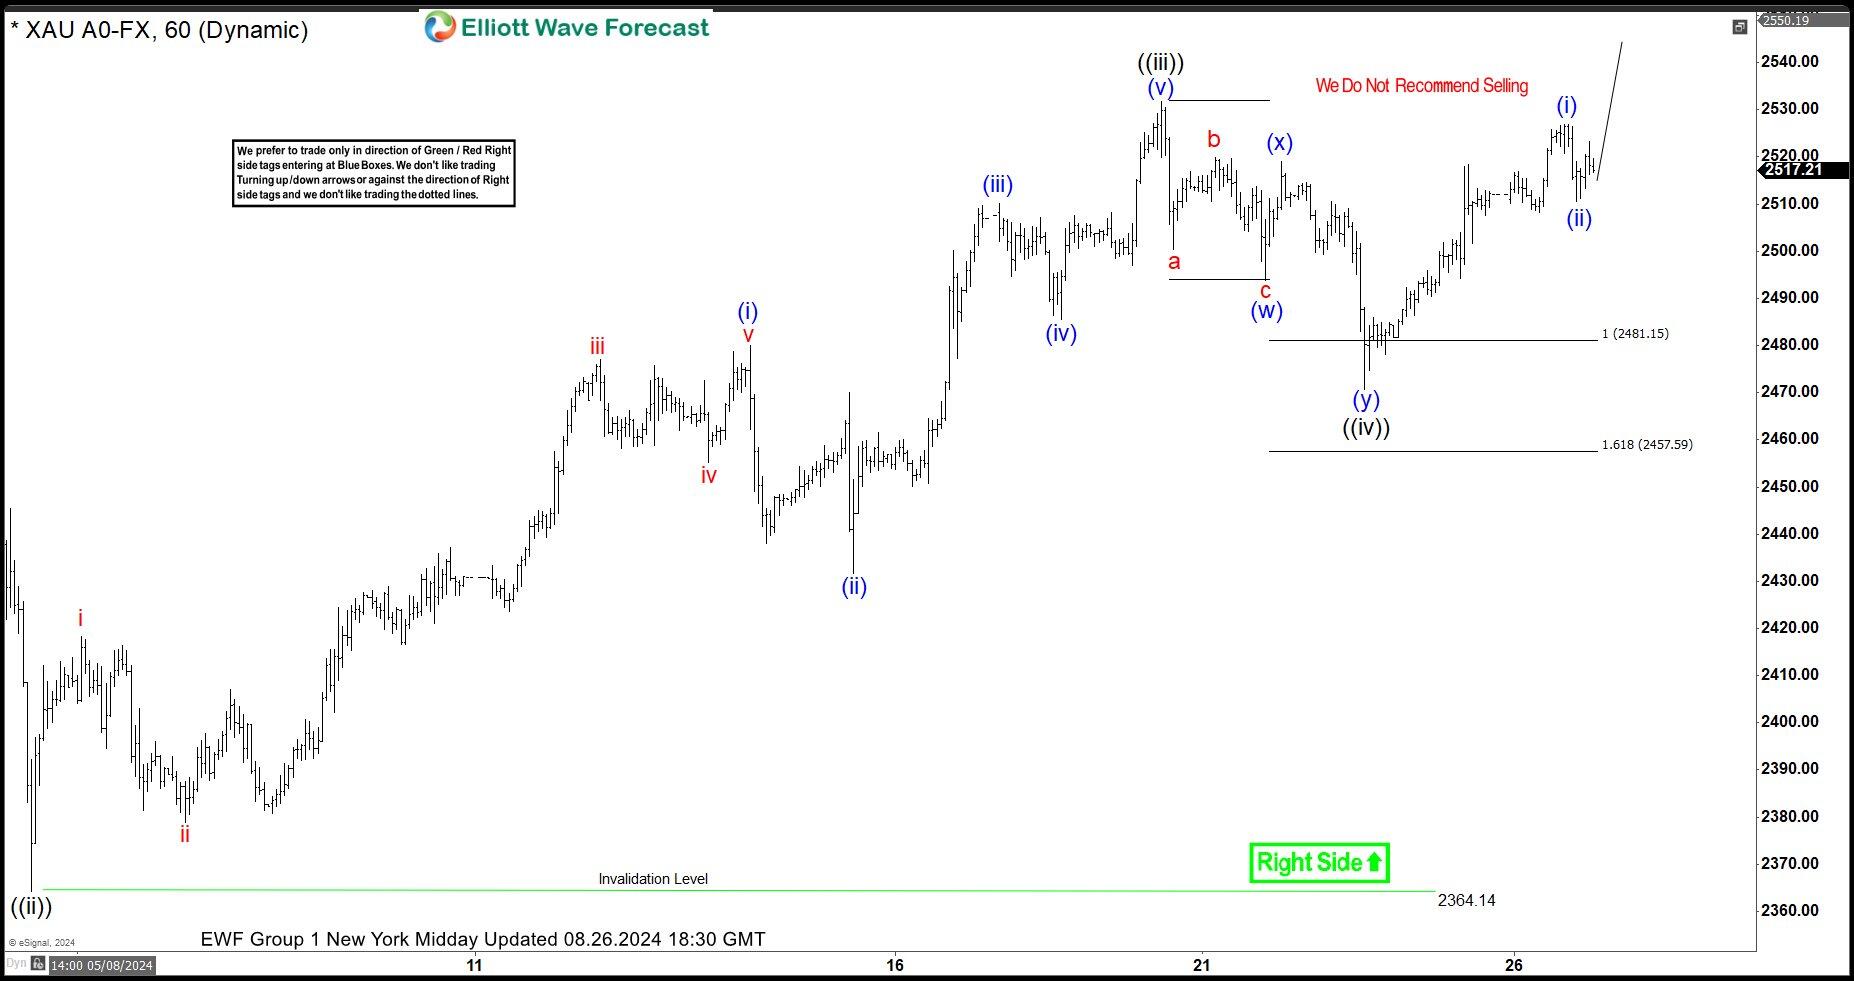
Above is the latest one-hour Elliott Wave chart from the 8.26.2024 NY Midday update. In which the metal is showing a perfect reaction higher taking place from the equal legs area. Right after ending the correction. Allowed members to create a risk-free position shortly after taking a long position. But a break above $2531.67 high would still be needed to confirm the next leg higher minimum towards the $2546.49- 2569.93 area before the next pullback takes place.

Author

Elliott Wave Forecast Team

Elliott Wave Forecast Team

ElliottWave-Forecast.com

More from Elliott Wave Forecast Team
Share:

Editor's Picks

EUR/USD hits two-day highs near 1.1820

EUR/USD picks up pace and reaches two-day tops around 1.1820 at the end of the week. The pair’s move higher comes on the back of renewed weakness in the US Dollar amid growing talk that the Fed could deliver an interest rate cut as early as March. On the docket, the flash US Consumer Sentiment improves to 57.3 in February.

GBP/USD reclaims 1.3600 and above

GBP/USD reverses two straight days of losses, surpassing the key 1.3600 yardstick on Friday. Cable’s rebound comes as the Greenback slips away from two-week highs in response to some profit-taking mood and speculation of Fed rate cuts. In addition, hawkish comments from the BoE’s Pill are also collaborating with the quid’s improvement.

Gold climbs further, focus is back to 45,000

Gold regains upside traction and surpasses the $4,900 mark per troy ounce at the end of the week, shifting its attention to the critical $5,000 region. The move reflects a shift in risk sentiment, driving flows back towards traditional safe haven assets and supporting the yellow metal.

Crypto Today: Bitcoin, Ethereum, XRP rebound amid risk-off, $2.6 billion liquidation wave

Bitcoin edges up above $65,000 at the time of writing on Friday, as dust from the recent macro-triggered sell-off settles. The leading altcoin, Ethereum, hovers above $1,900, but resistance at $2,000 caps the upside. Meanwhile, Ripple has recorded the largest intraday jump among the three assets, up over 10% to $1.35.

Three scenarios for Japanese Yen ahead of snap election

The latest polls point to a dominant win for the ruling bloc at the upcoming Japanese snap election. The larger Sanae Takaichi’s mandate, the more investors fear faster implementation of tax cuts and spending plans. 

XRP rally extends as modest ETF inflows support recovery

Ripple is accelerating its recovery, trading above $1.36 at the time of writing on Friday, as investors adjust their positions following a turbulent week in the broader crypto market. The remittance token is up over 21% from its intraday low of $1.12.