Gold Elliott Wave analysis [Video]
![Gold Elliott Wave analysis [Video]](https://editorial.fxstreet.com/images/Markets/Commodities/Metals/Gold/Gold_Bar_XAU_Precious_Metal_XtraLarge.jpg)
Gold Elliott Wave analysis
Function - Counter-trend.
Mode - Corrective.
Structure - Possible zigzag.
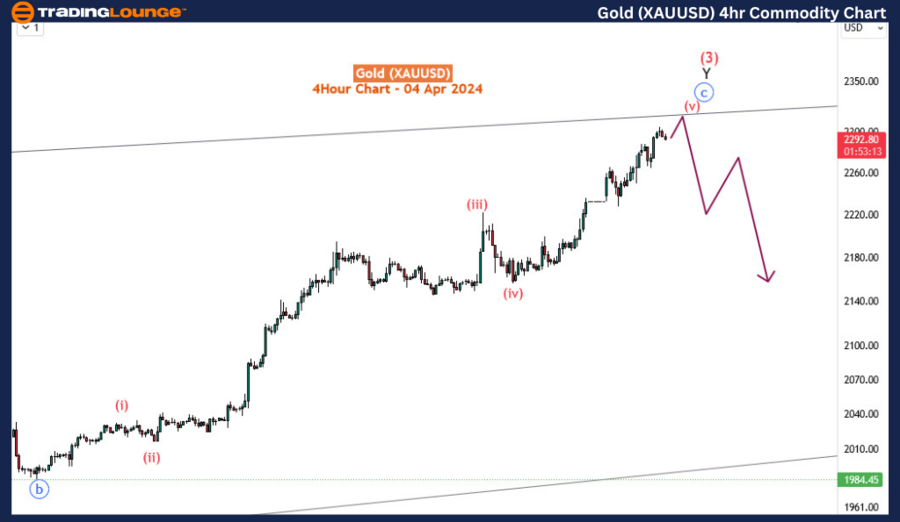
Position -Wave (v) of blue ‘c’.
Direction - Wave (v) of blue ‘c’ still in play.
Details - Gold strengthens for wave (v) of blue ‘c’ of Y of 3. It seems to be in the last phase and can turn bearish to begin wave (4) after completing an impulse for (v).
Following its establishment of a new all-time high in December, Gold underwent a pullback lasting just over two months before embarking on a renewed rally to achieve another fresh all-time high in early March. Since then, the metal has maintained its upward trajectory without hesitation. With expectations of further rally ahead, adopting a strategy of buying dips appears prudent for investors seeking to capitalize on Gold's momentum. In today's commodity blog post, we will explore what Gold traders and investors should anticipate and where potential trading opportunities may arise through the lens of Elliott wave theory.
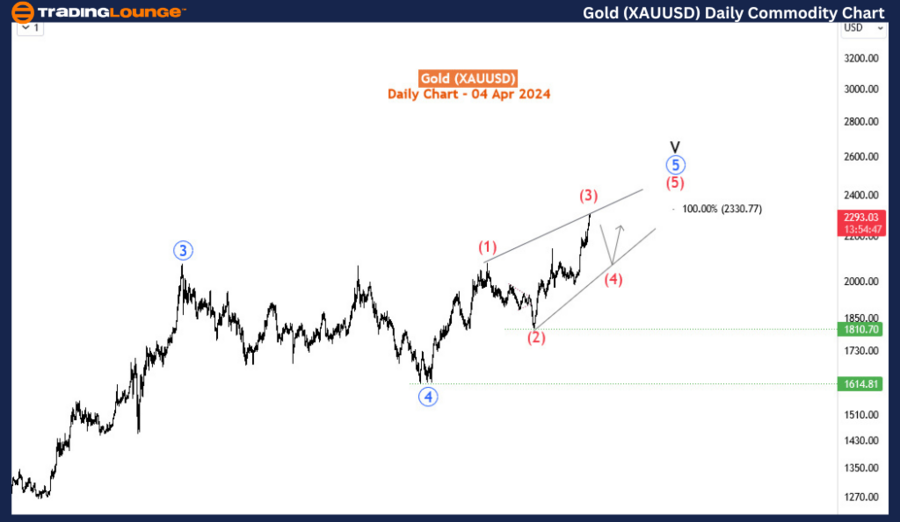
Examining the daily timeframe reveals the emergence of an impulse wave pattern since December 2015, labeled in blue (circled). The 4th wave (blue wave 4) of this pattern concluded at the September 2022 low of 1614.8, marking the commencement of the 5th wave. According to Elliott wave theory, the 5th wave can manifest as either an impulse or an ending diagonal. The former is characterized by a 5,3,5,3,5 structure, while the latter comprises a 3,3,3,3,3 structure. Notably, waves (1), (2), and (3) from 1614 exhibit subdivisions into three waves each, suggesting the unfolding of an ending diagonal for wave 5 (blue circled). However, as wave (3) approaches the invalidation level of the ending diagonal at 2330.77, it is likely nearing its conclusion, signaling an imminent pullback for wave (4).
Transitioning to the H4 timeframe, wave (3) subdivides into a double three pattern labeled as waves W, X, and Y. Presently, we are in the process of completing the final leg of Y, namely wave (v) of blue c of Y, which should suffice to finalize wave (3). While no discernible indications of a pullback are evident yet, it is reasonable to anticipate its occurrence shortly, particularly below the invalidation level of 2330.77. Nevertheless, adhering to the overarching trend, buying the dips remains the favored strategy for trading Gold, offering a safer approach to capitalize on its upward trajectory. As such, traders are advised to remain vigilant and align their strategies accordingly to exploit potential trading opportunities in the market.
Technical Analyst: Sanmi Adeagbo.
Gold Elliott Wave analysis [Video]
Author

Peter Mathers
TradingLounge
Peter Mathers started actively trading in 1982. He began his career at Hoei and Shoin, a Japanese futures trading company.


