Gold, Chart of the Week: XAU/USD trapped bulls into the Fed and NFP
- Gold price is in the upper third of the 2023 range and on the backside of the first major trendline that is broken.
- A break of $ $1,925 opens the risk of a move to test last week's low of $1,896 and then $1,867 as the top of the lower third of the range.

Gold prices steadied, with gains capped by the stronger dollar and analysts at TD Securities argued that the yellow metal need only close above the $1,935 range to catalyze a marginal buying program, whereas a close below the $1,890 mark is required to spark a trend follower selling flow.
This makes for a very important week ahead for the Gold price considering the Federal Open Market Committee is expected to only to deliver a 25bp rate increase, lifting rates to 4.50%-4.75%. Futures showed the market pricing in a slightly higher peak of the Fed's overnight lending rate at 4.912% in June. The market then sees rates easing to 4.473% in December on expectations the Fed will cut rates later this year.
We also get the US Nonfarm Payrolls employment report that likely continued to rise in January, although the expectations of 175k increase in payrolls would not be far off the smallest gain since a drop in December 2020. Nevertheless, the labour market remains tight and layoffs are still very low. However, the Unemployment Rate will be key and the expectation is a rise to 3.6% from 3.5% in December which would be likely damaging to the US Dollar and supportive of the Gold price.
A move representing a second consecutive downshift in the Fed's hiking pace is deemed positive for the Gold price but the post-meeting communication could still emphasize that the Fed is not done yet in terms of tightening its policy stance, signalling that more rate hikes are still in the pipeline and hence the volatility could be extreme this week.
So let's move to the charts:
Gold price technical analysis
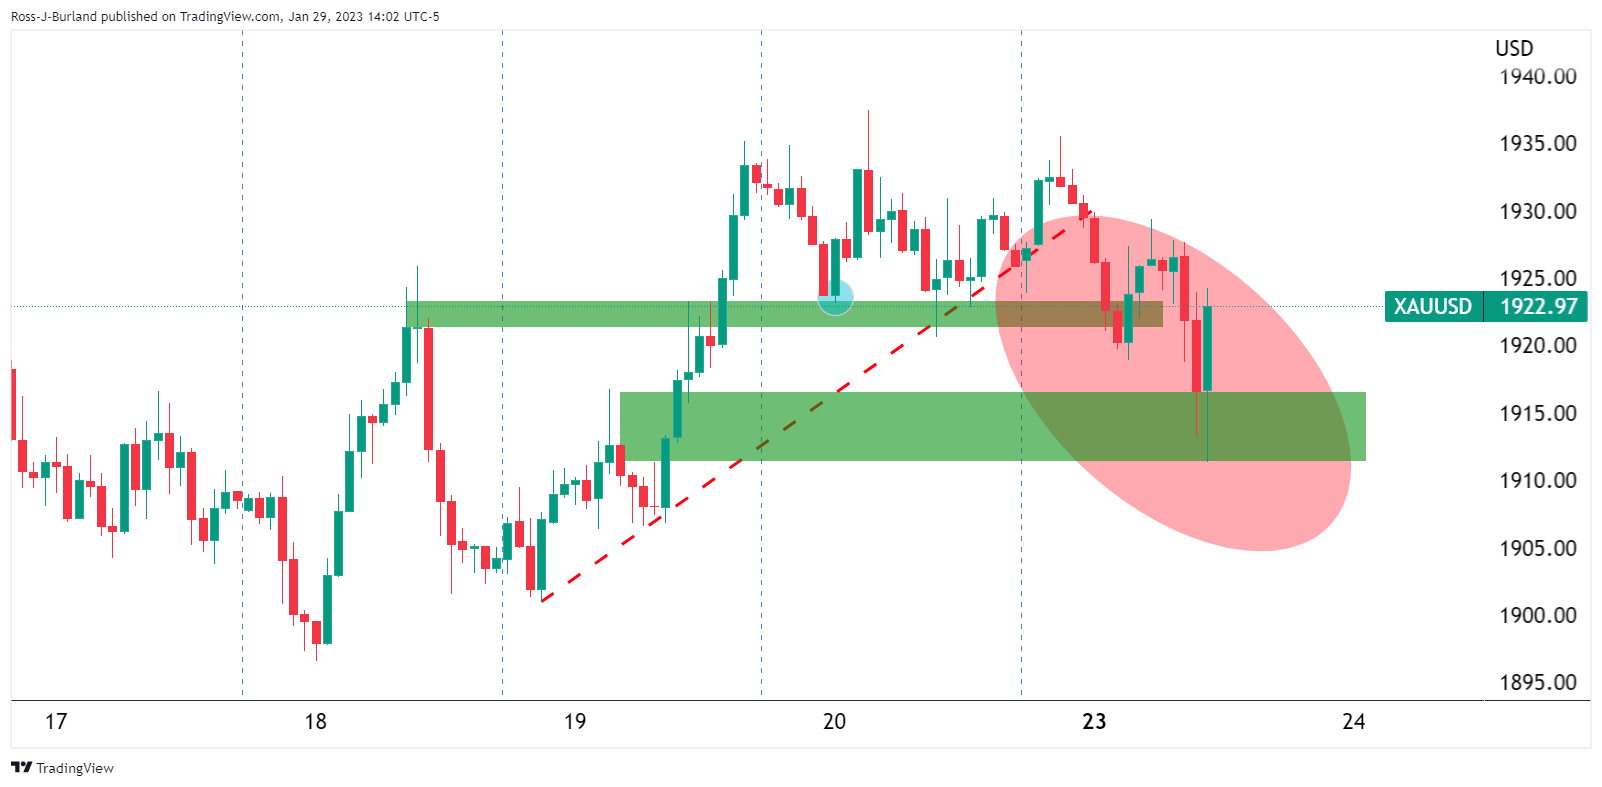
As per the prior week's pre-open analysis ...

... where the price was forecasted to head lower and a break of $1,923 could open the risk of a move even lower. We got the drop to test the first major support structure as follows:
However, breakout traders chasing the move were burned back into the counter trendline:
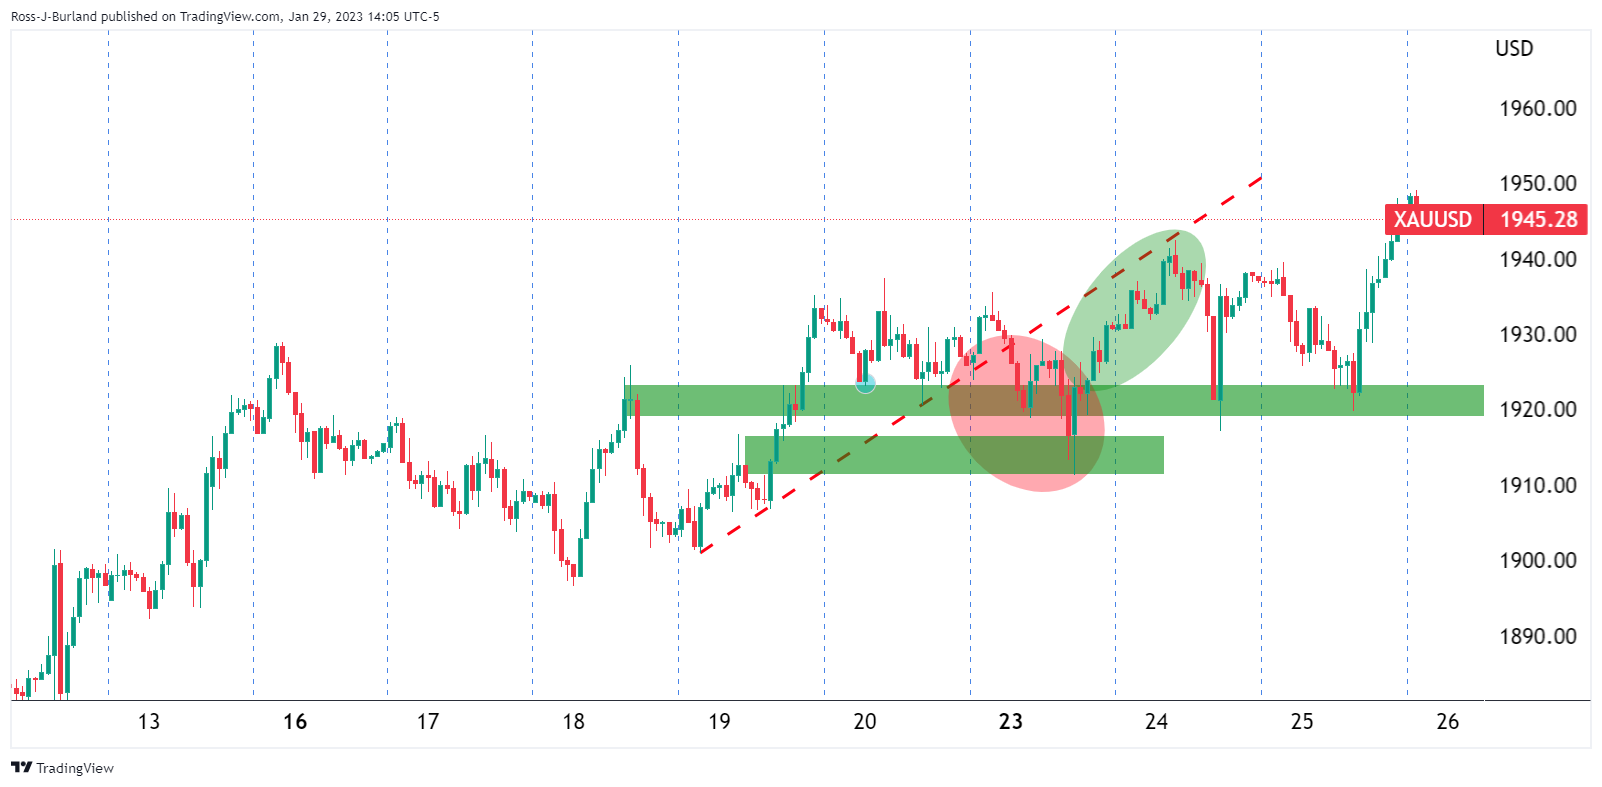
The price has subsequently moved into a wider consolidation:
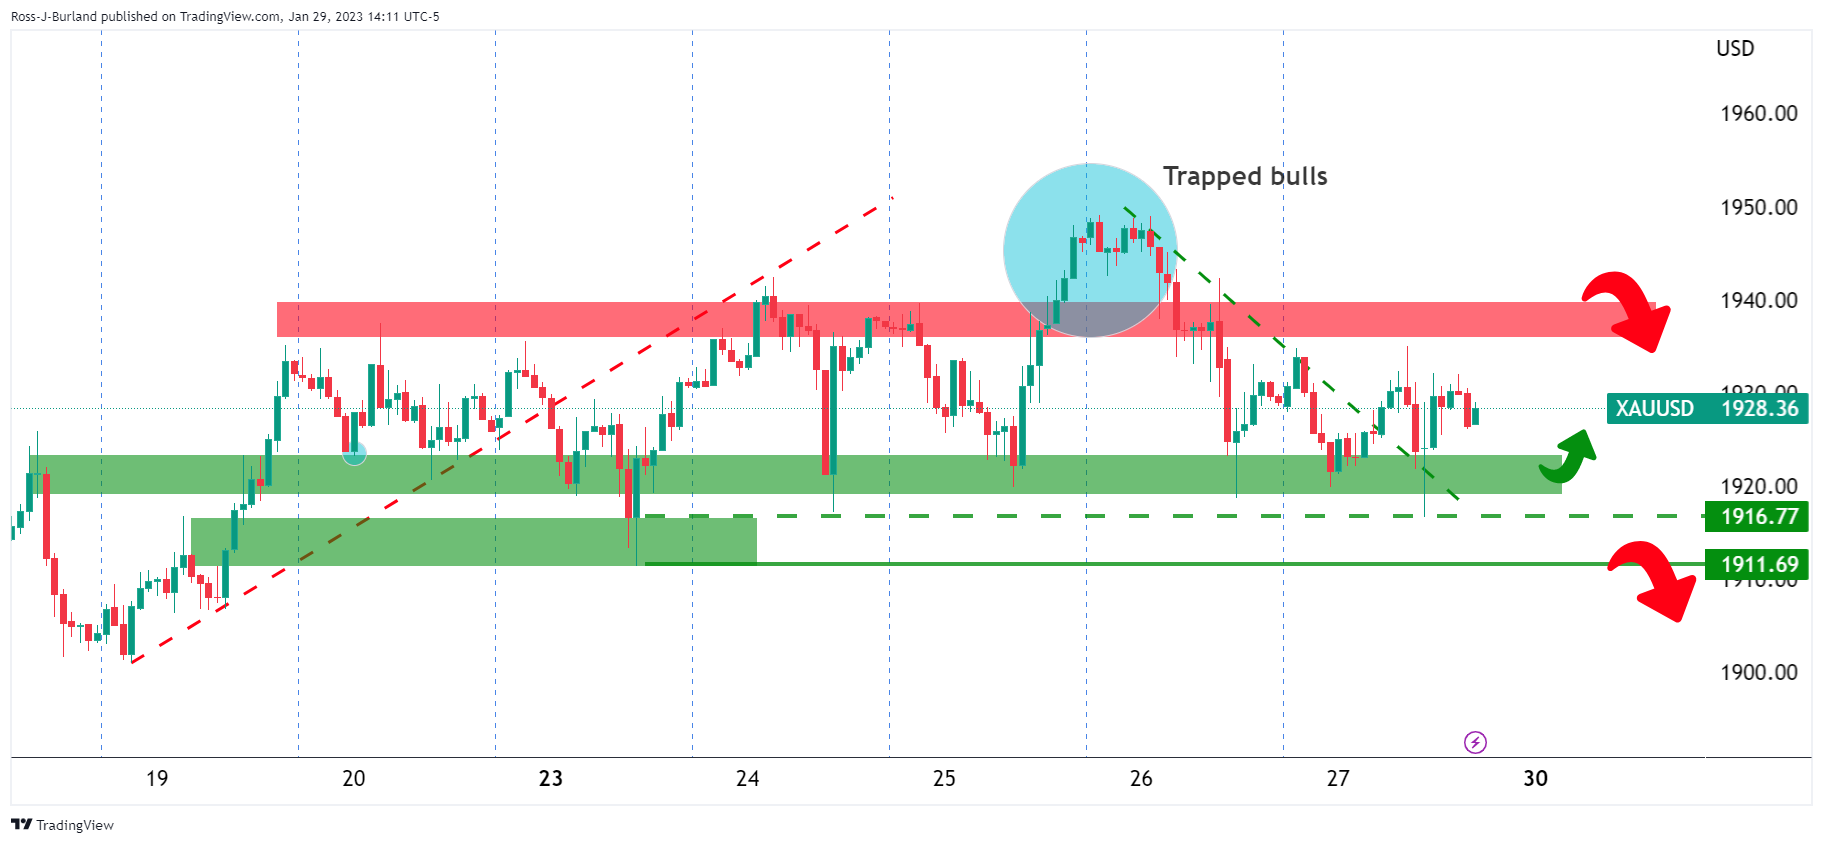
What is particularly interesting, however, is the longer-term time frame structure. Let's move to the daily chart:
Gold price daily chart
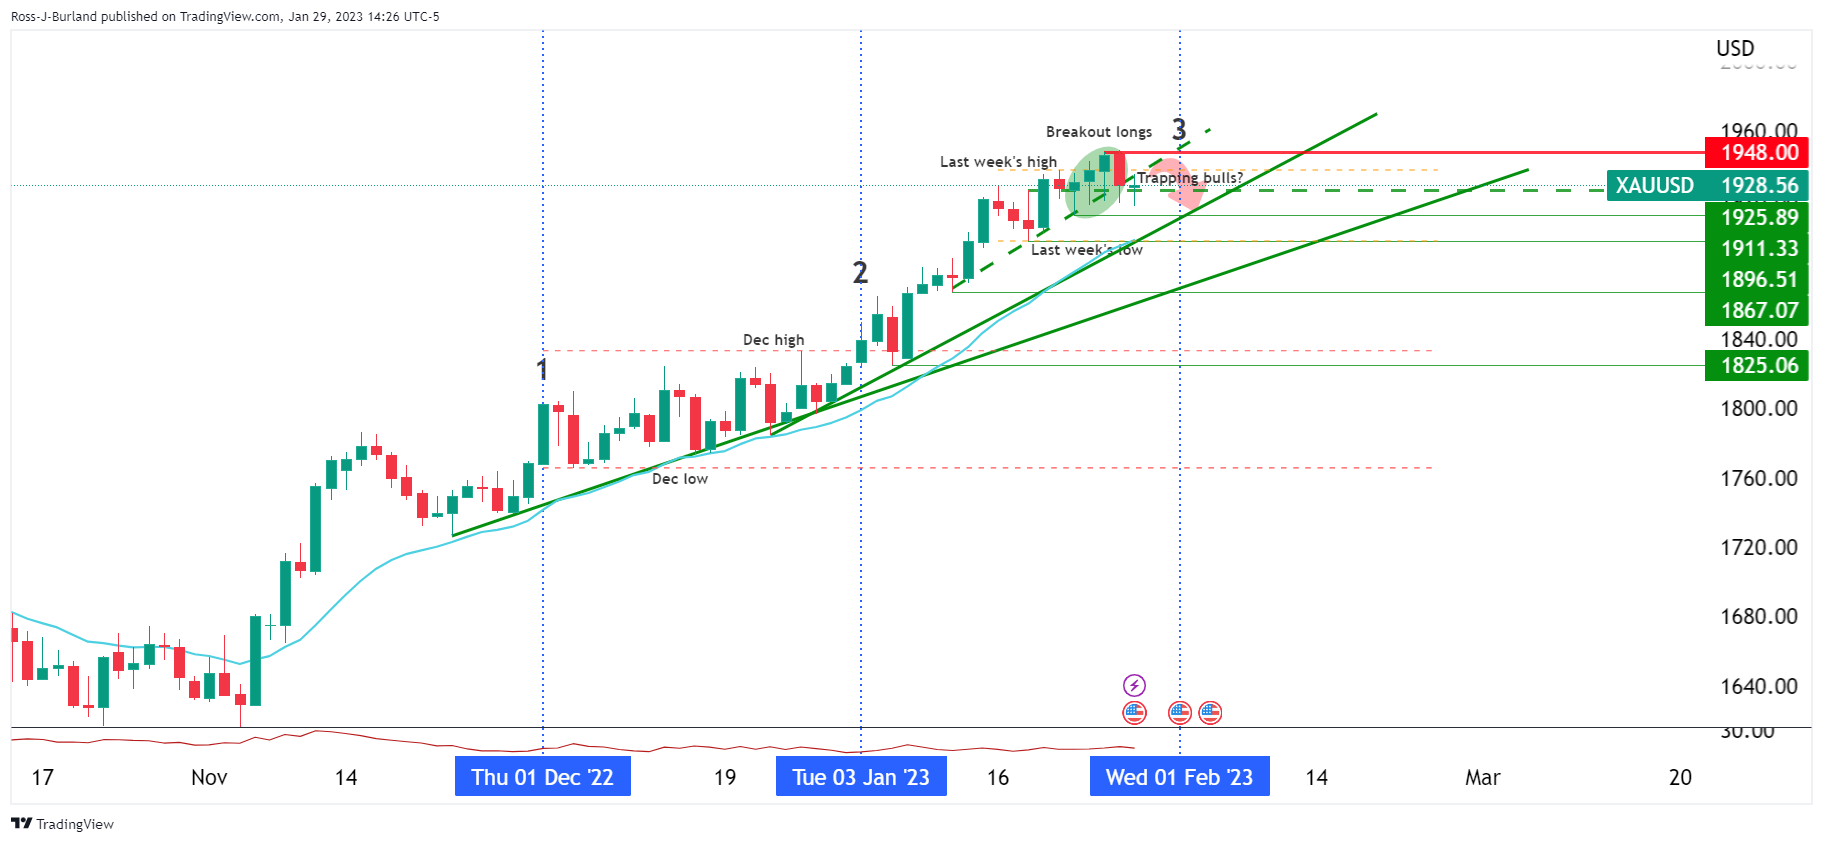
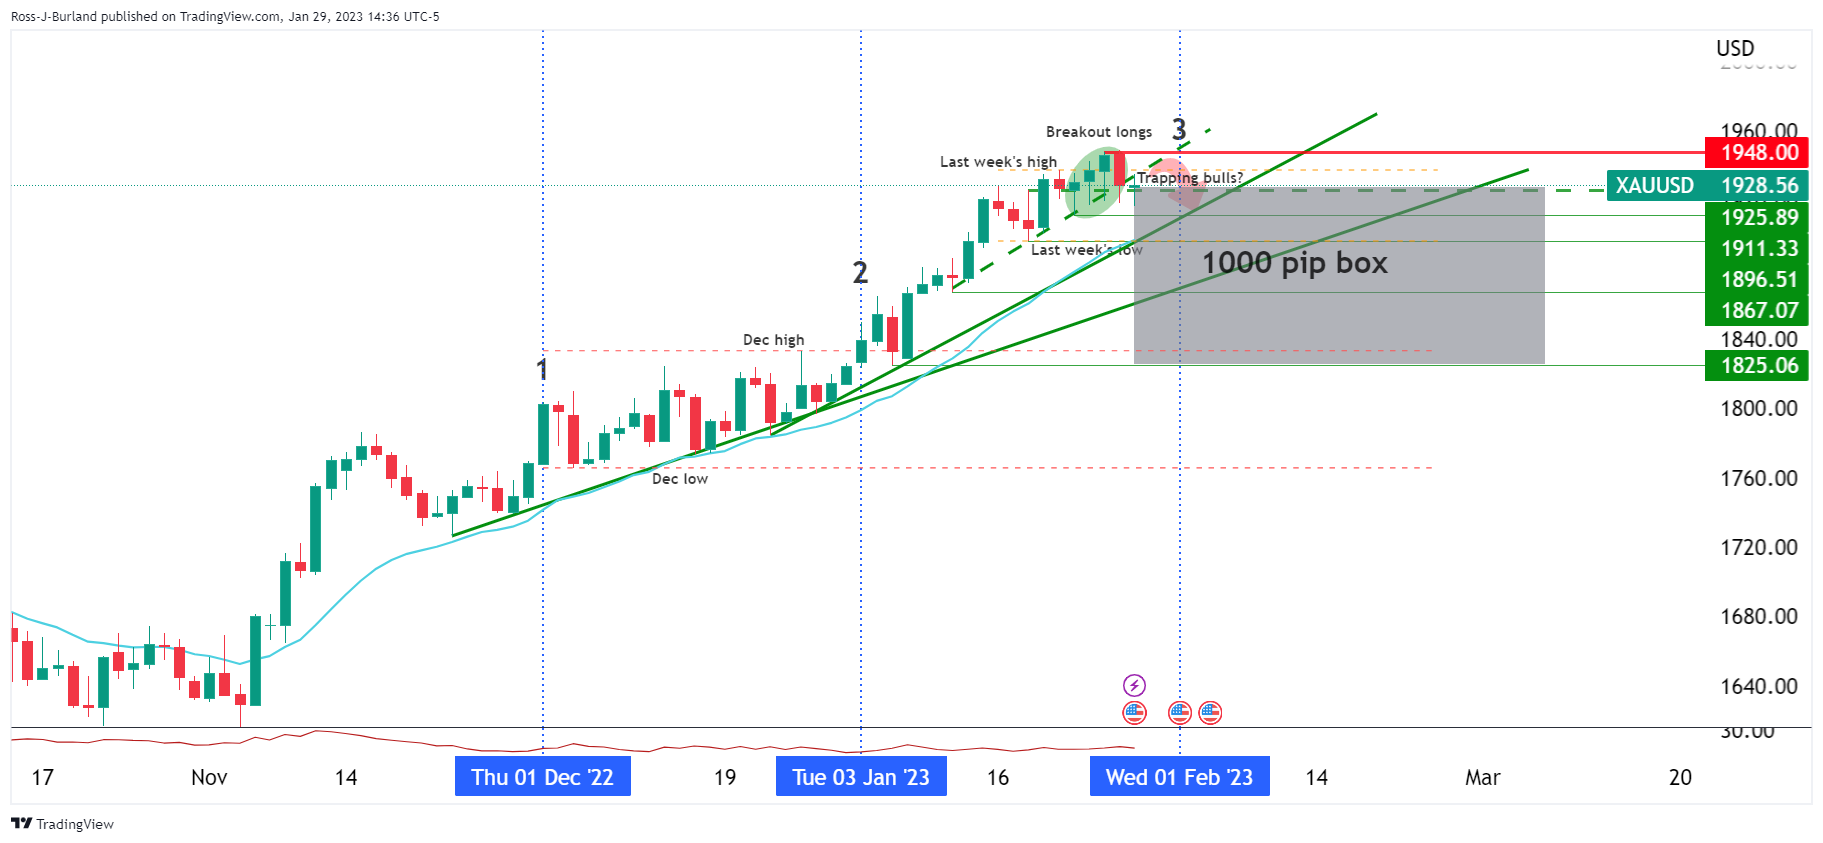
As illustrated, we have a number of interesting developments on the daily chart. Firstly, we have had two positive monthly closes and we could be headed for the third monthly rise this week by the close of January's business having made a fresh high for the cycle last Thursday. This made for three weeks of interrupted weekly gains. The next interesting development is the 1000 pip box the market has carved out between the January swing lows of $1,925, the current daily structure, and the January lows and starting balance of $1,825. Then, we have traders expecting a continuation higher on the break of last week's highs of $1,938 and a market pulling back into their stops and towards the top of the 1000 pip box, trapping stubborn bulls:
Zooming in we can see that a 3-line strike is in play:
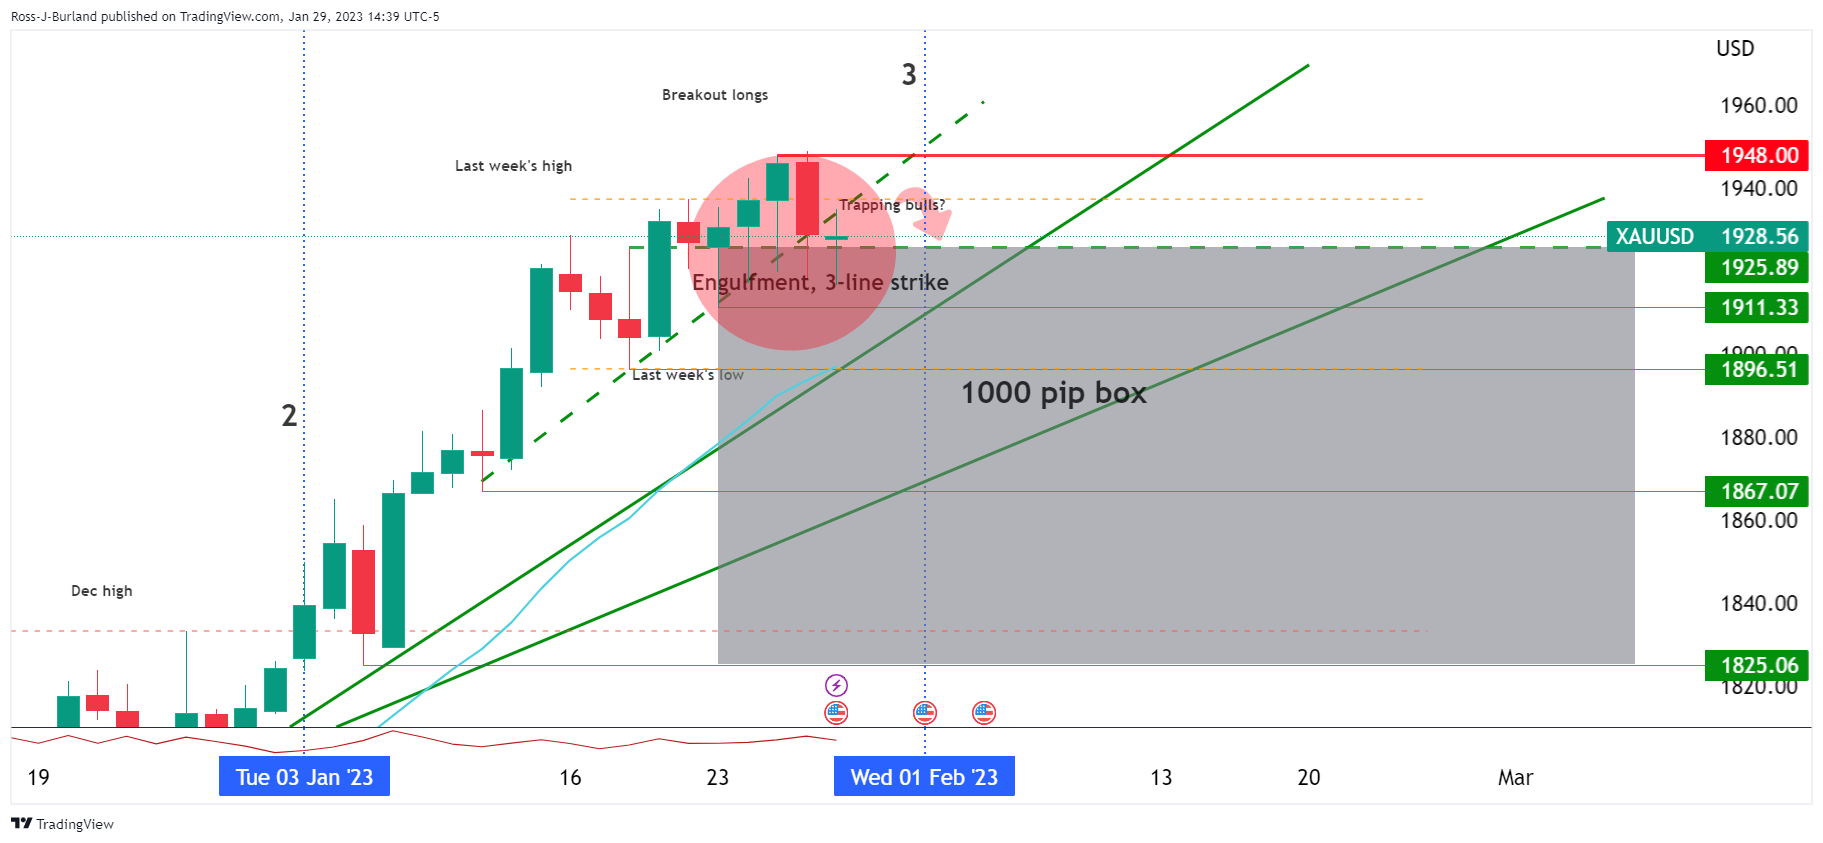
This is a trend continuation candlestick pattern consisting of four candles. In this particular scenario, we did not have the close below the first of the four candles, but this is a bearish scenario nonetheless considering the combination of trapped bulls in such an extended bull cycle. we are up high in the opening range for the year so far and a new balance for February could see a move to pare back some of the gains made so far for 2023:
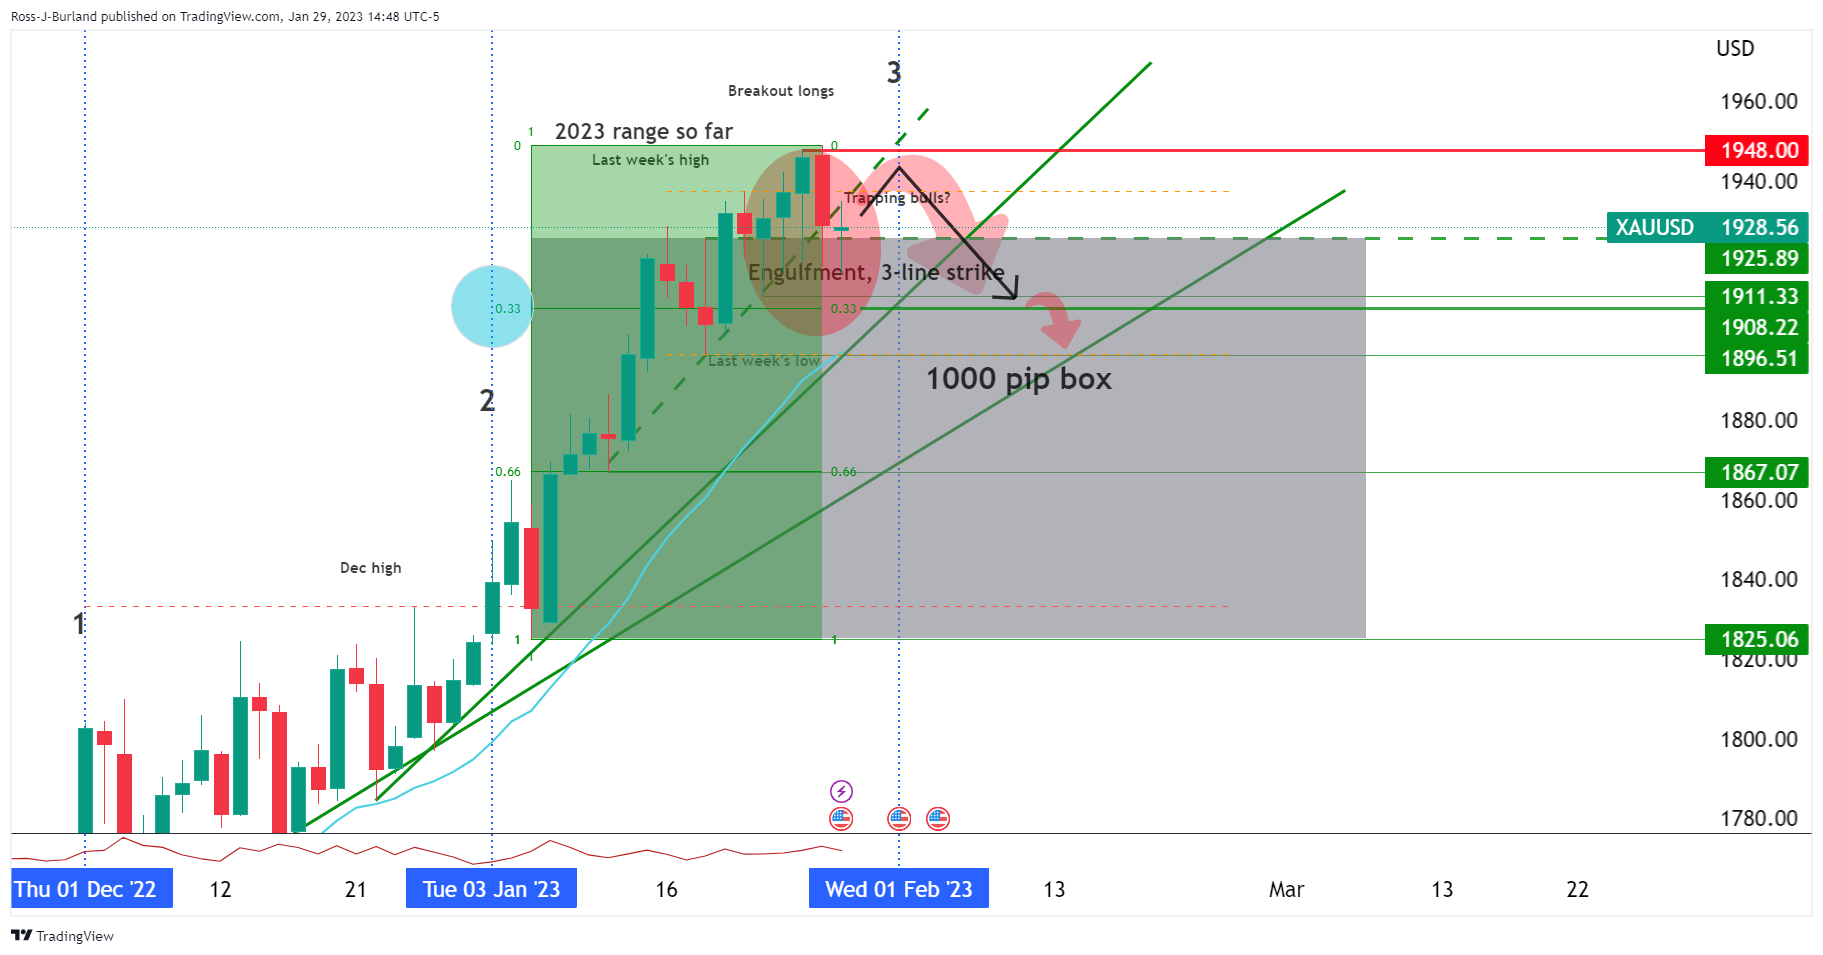
As illustrated, we are in the upper third of the 2023 range and on the backside of the first trendline that is broken and acting as a counter-trendline. A break of $ $1,925 opens the risk of a move to test last week's low of $1,896 and then $1,867 as the top of the lower third of the range.
Premium
You have reached your limit of 3 free articles for this month.
Start your subscription and get access to all our original articles.
Author

Ross J Burland
FXStreet
Ross J Burland, born in England, UK, is a sportsman at heart. He played Rugby and Judo for his county, Kent and the South East of England Rugby team.


