|

Gold, Chart of The Week: XAU/USD meeting critical resistance near $1,830

  • Gold is pressing against a critical resistance for the open this week.
  • A break of $1,830 opens risk towards $1,850 while a move lower will target $1,820 and then $1,805. 

The price of gold surged during the holidays from around the $1,800 psychological level into the $1,830 area which would be expected to act as a resistance on initial tests. The following is a snapshot of the market's structure from a weekly, daily and 4-hour perspective:

Gold, weekly chart

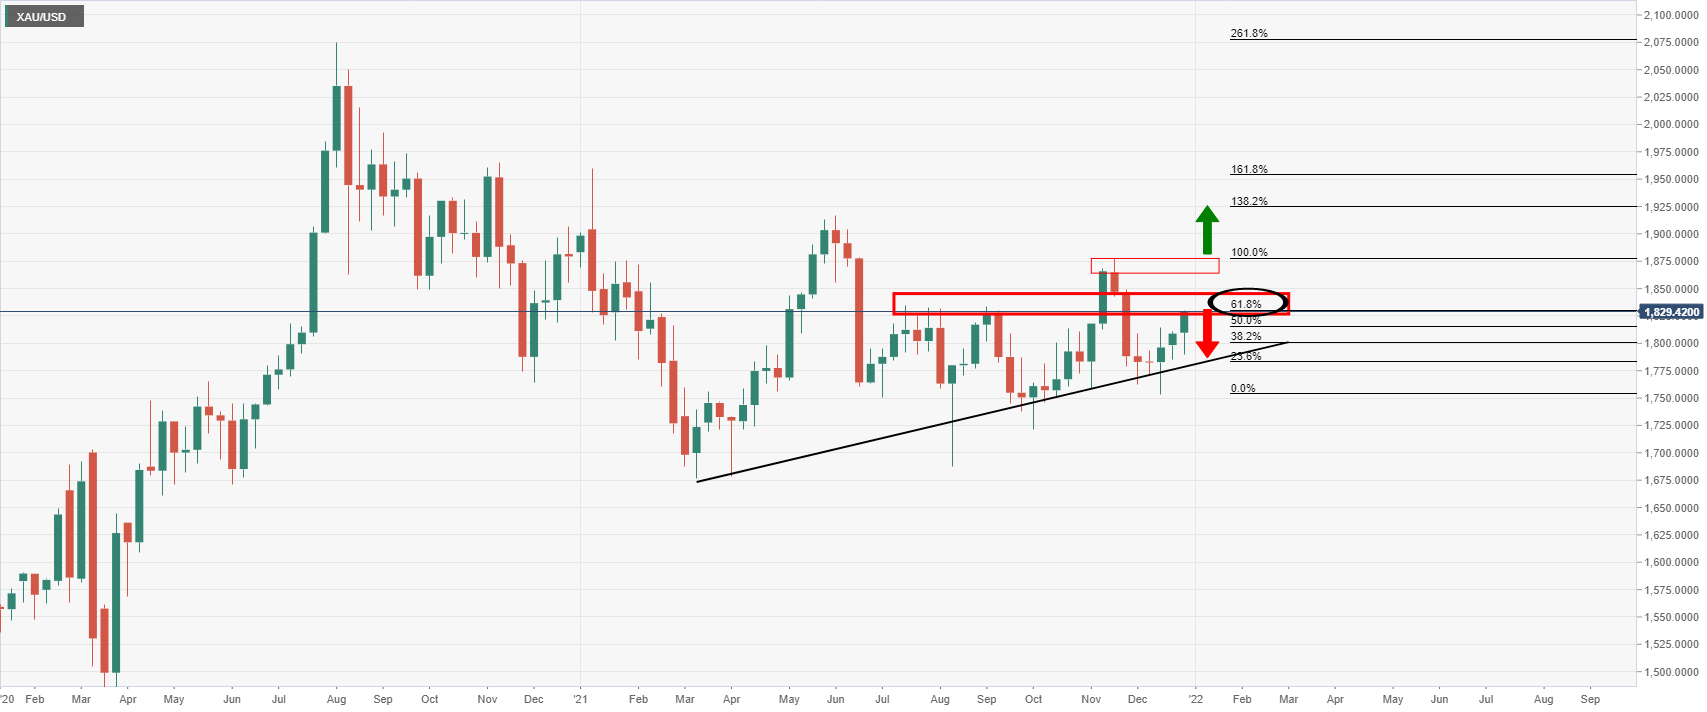
As illustrated, the price is heading higher following another test of the weekly trendline support. The price has made a 61.8% Fibonacci retracement of the prior bearish impulse.

The 61.8% ratio is regarded as a significant prospect for a pivot in price action. In this scenario, bears could be looking for the area to hold and potentially result in an opportunity on the downside on lower time frames. However, should the resistance area give way, then bulls would be encouraged and the price would be expected to move towards the $1,850s.

Gold, daily chart

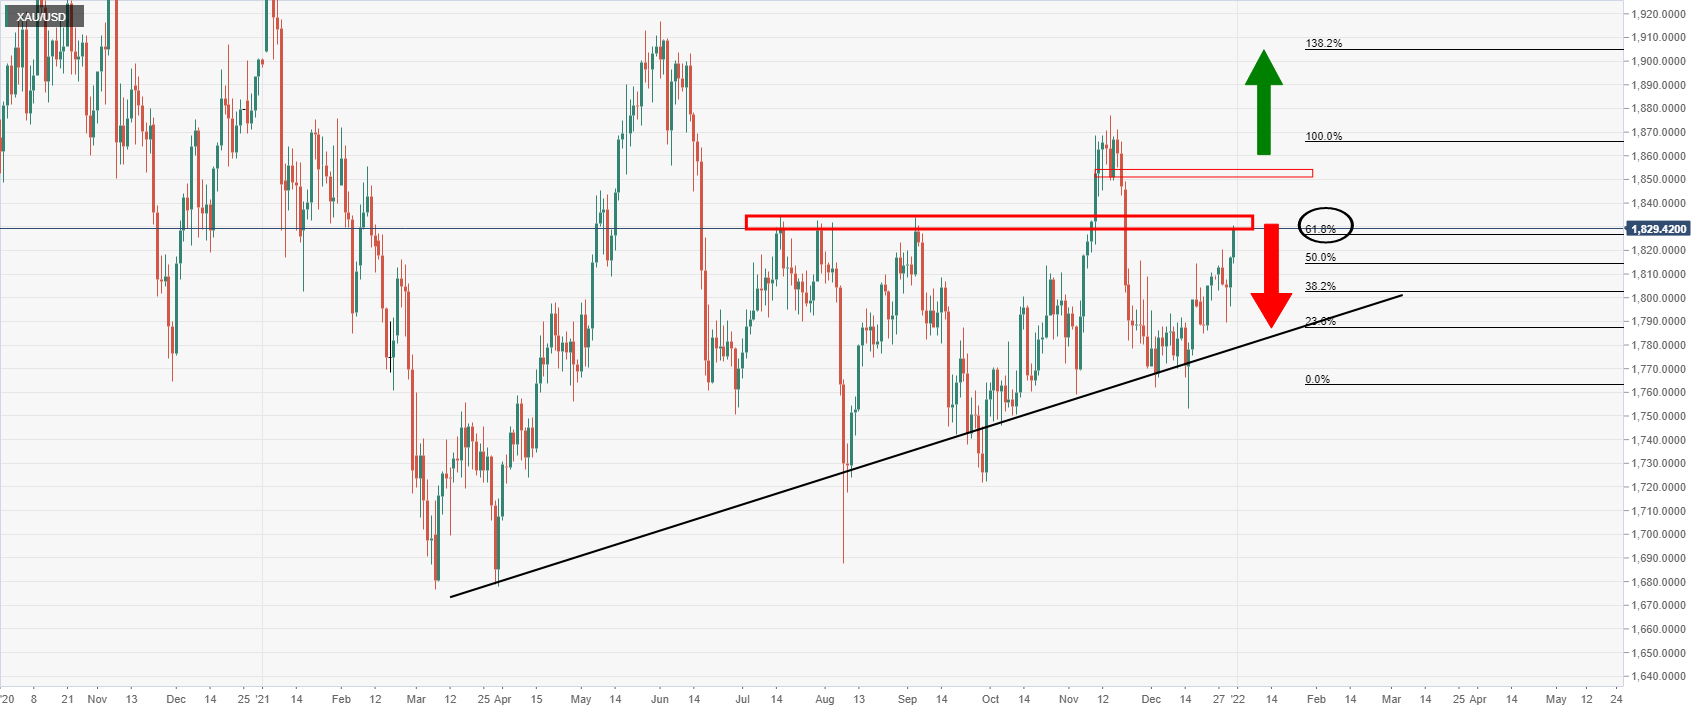
Again, the daily chart shows the same bias as the weekly chart.
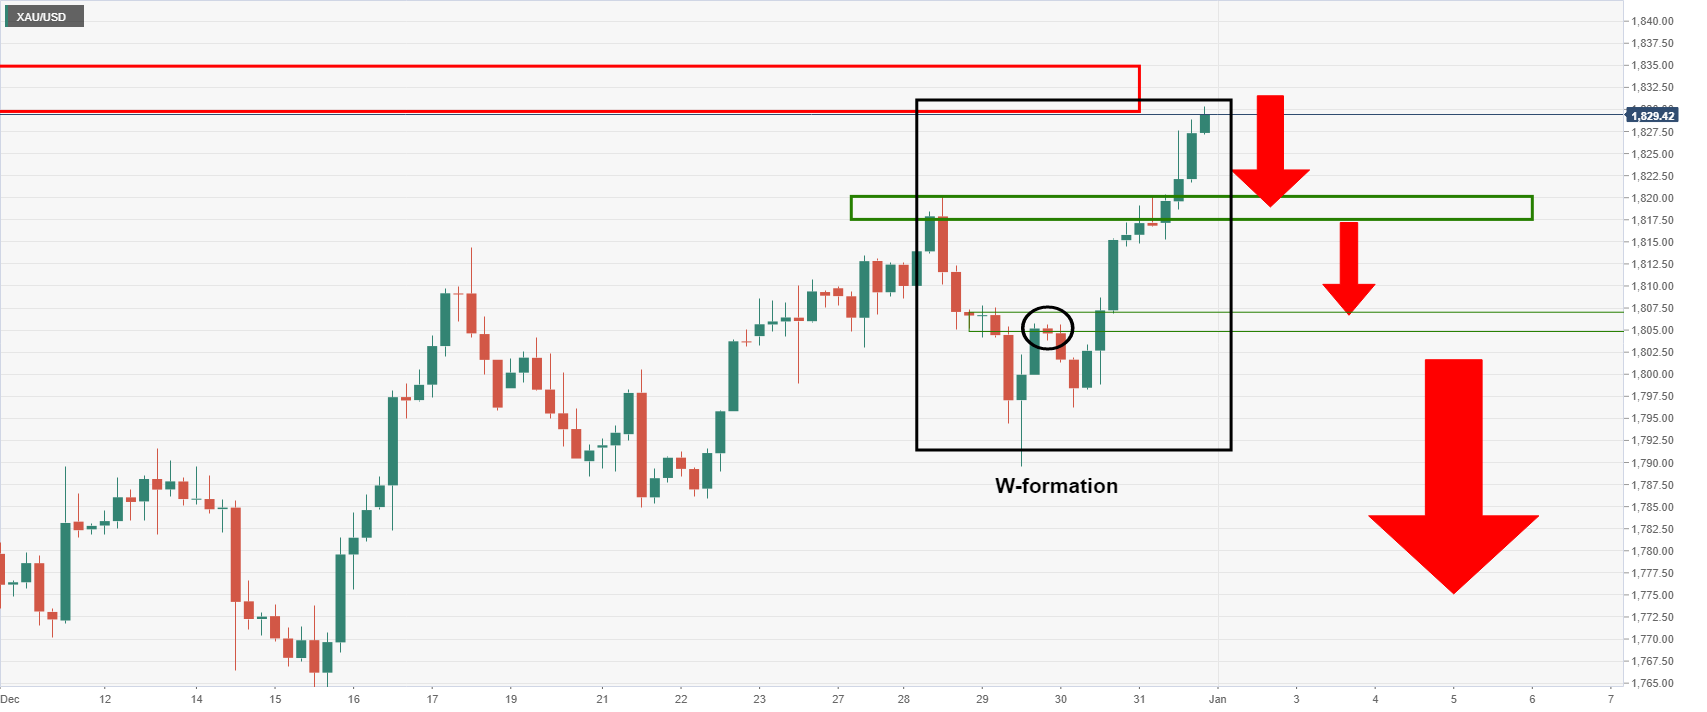
Gold, H4 chart

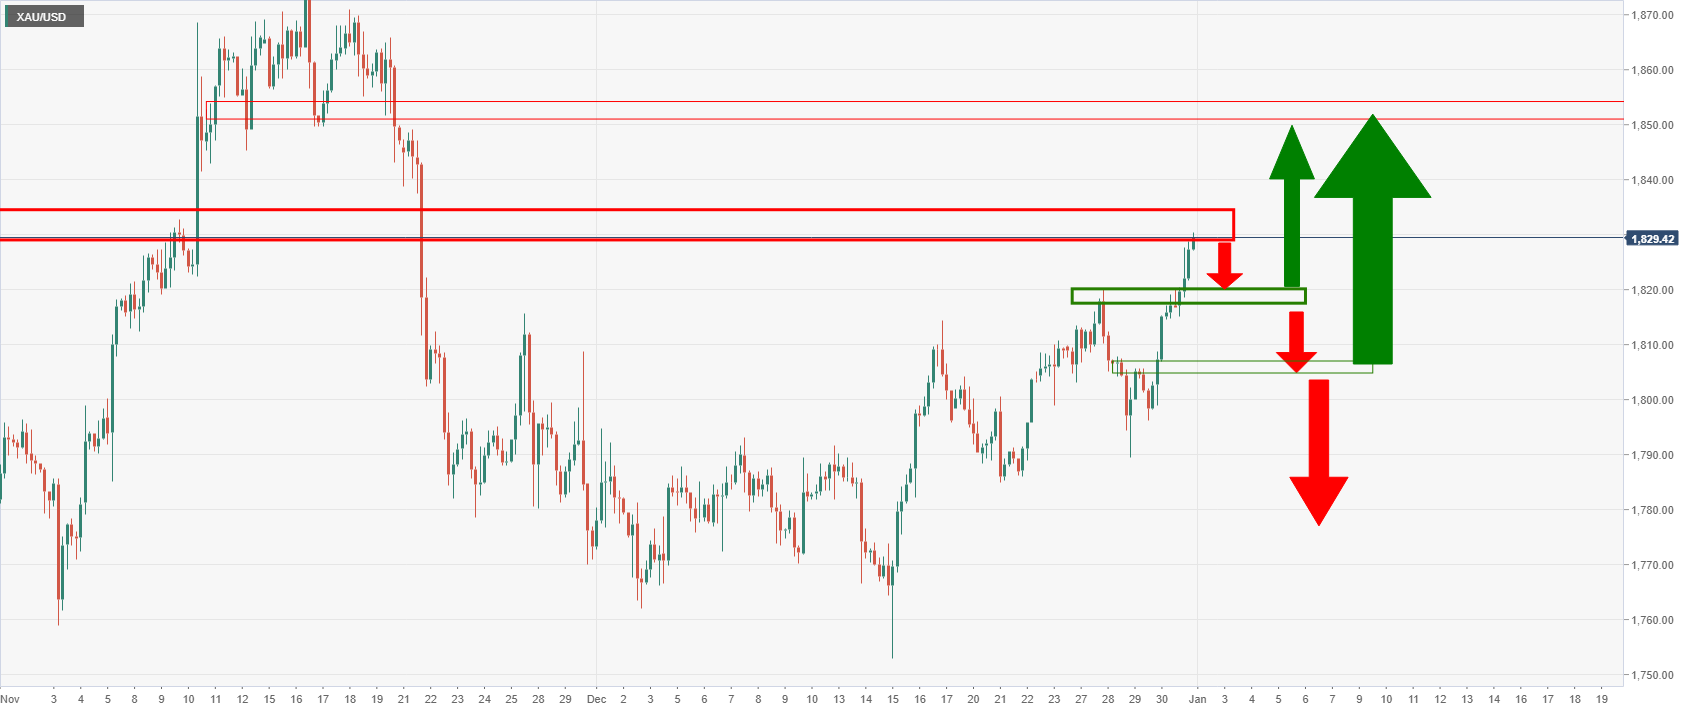
From a 4-hour perspective, the bulls are in charge although the resistance could see the price fail at first attempts for the open this week. In doing so, then $1,820 would be expected to act as support before $1,805 below there as per the neckline of the W-formation:

Premium

You have reached your limit of 3 free articles for this month.

Start your subscription and get access to all our original articles.

Subscribe to PremiumSign In

Author

Ross J Burland

Ross J Burland, born in England, UK, is a sportsman at heart. He played Rugby and Judo for his county, Kent and the South East of England Rugby team.

More from Ross J Burland
Share:

Markets move fast. We move first.

Orange Juice Newsletter brings you expert driven insights - not headlines. Every day on your inbox.

By subscribing you agree to our Terms and conditions.

Editor's Picks

EUR/USD falls toward 1.1700 on broad USD recovery

EUR/USD turns south and declines toward 1.1700 on Wednesday. The US Dollar gathers recovery momentum and forces the pair to stay on the back foor, as traders look to USD short-covering ahead of US inflation report on Thursday. However, the downside could be capped by hawkish ECB expectations. 

GBP/USD trades deep in red below 1.3350 after soft UK inflation data

GBP/USD stays under strong selling pressure midweek and trades below 1.3350. The UK annual headline and core CPI rose by 3.2% each, missing estimates of 3.5% and 3.4%, respectively, reaffirming dovish BoE expectations and smashing the Pound Sterling across the board ahead of Thurday's BoE policy announcements. 

Gold clings to moderate daily gains above $4,300

Following Tuesday's volatile action, Gold regains its traction on Wednesday and trades in positive territory above $4,300. While the buildup in the USD recovery momentum caps XAU/USD's upside, the cautious market stance helps the pair hold its ground.

Bitcoin risks deeper correction as ETF outflows mount, derivative traders stay on the sidelines

Bitcoin (BTC) remains under pressure, trading below $87,000 on Wednesday, nearing a key support level. A decisive daily close below this zone could open the door to a deeper correction.

Monetary policy: Three central banks, three decisions, the same caution

While the Fed eased its monetary policy on 10 December for the third consecutive FOMC meeting, without making any guarantees about future action, the BoE, the ECB and the BoJ are holding their respective meetings this week. 

AAVE slips below $186 as bearish signals outweigh the SEC investigation closure

Aave (AAVE) price continues its decline, trading below $186 at the time of writing on Wednesday after a rejection at the key resistance zone. Derivatives positioning and momentum indicators suggest that bearish forces still dominate in the near term.