|

Gold, Chart of the Week: XAU/USD bulls take charge to challenge critical resistance

  • Gold bulls eye a break of the resistance near $1,860 and a 50% mean reversion target on the weekly chart after that. 
  • The daily W-formation is problematic in the near future. 

As per the prior week's analysis, the price moved in on a 61.8% Fibonacci retracement on the 4-hour time frame, but the weekly target of $1,780 remains elusive with the bulls moving on last week at $1,786.78.

Gold, prior analysis H4 chart

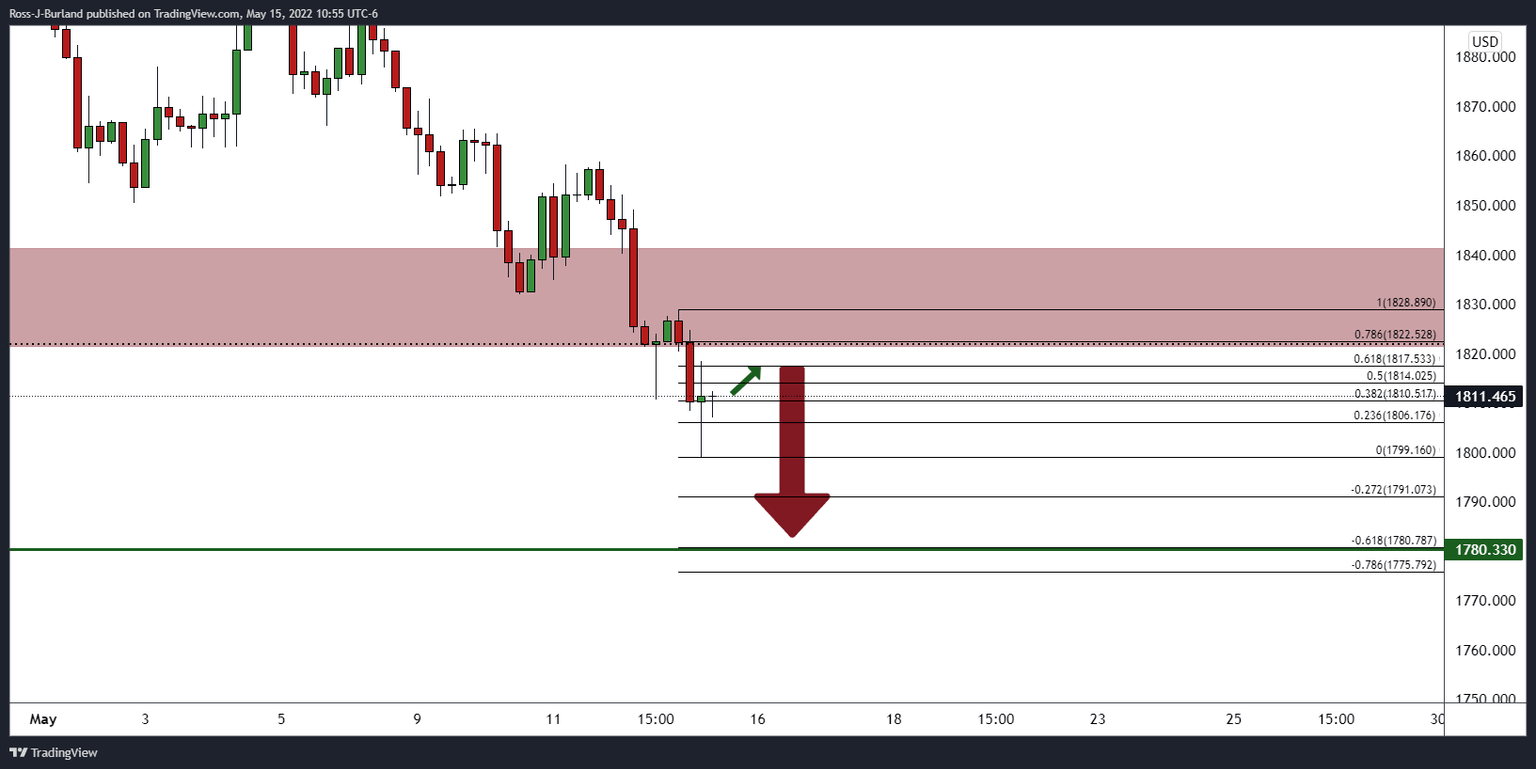
As illustrated, the price was forecasted to correct to the 61.8% ratio and then move lower towards the weekly $1,780 target. The outcome is as follows:

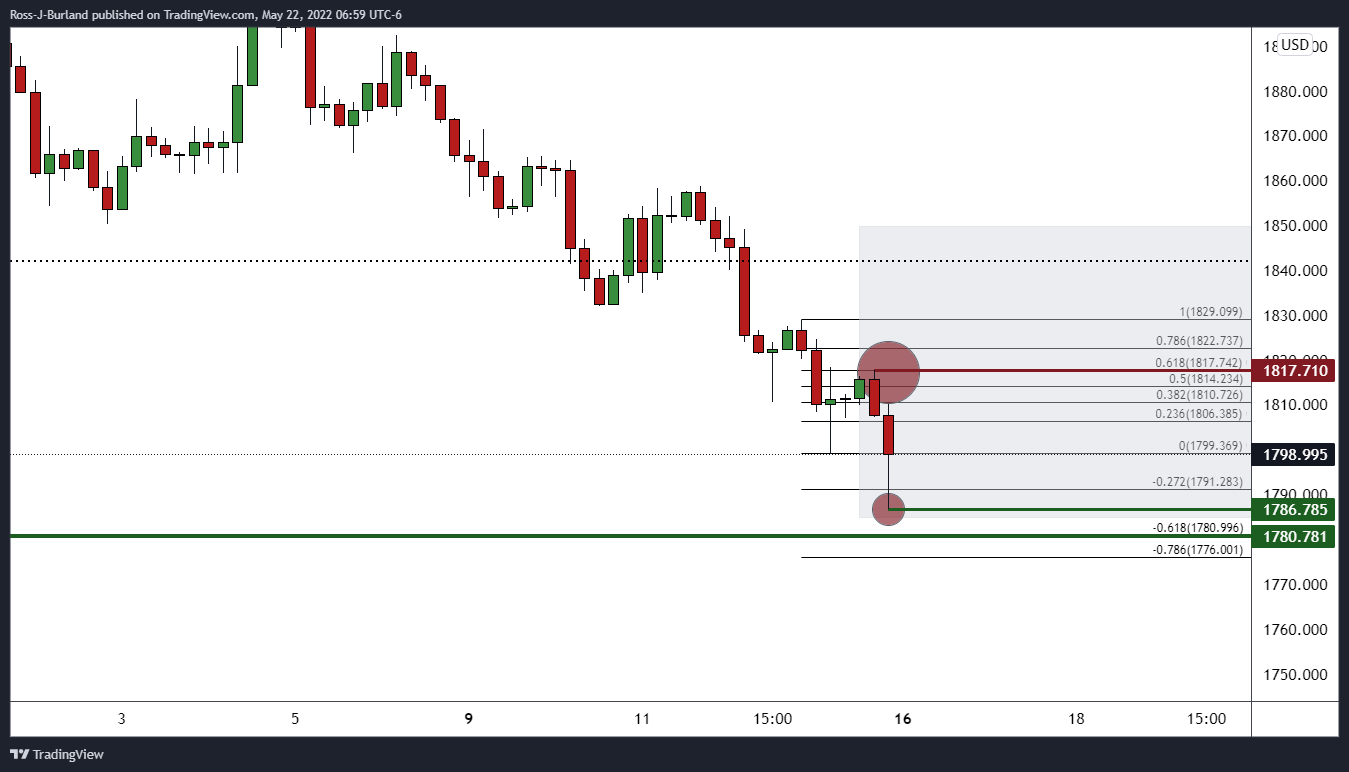
The price met the 61.8%-ratio for a perfect touch before melting towards the target. However, the bulls moved in $6.00 shy of the level. The price has since moved higher to test commitments in the vicinity of the $1,850 area:

Gold, live H4 chart

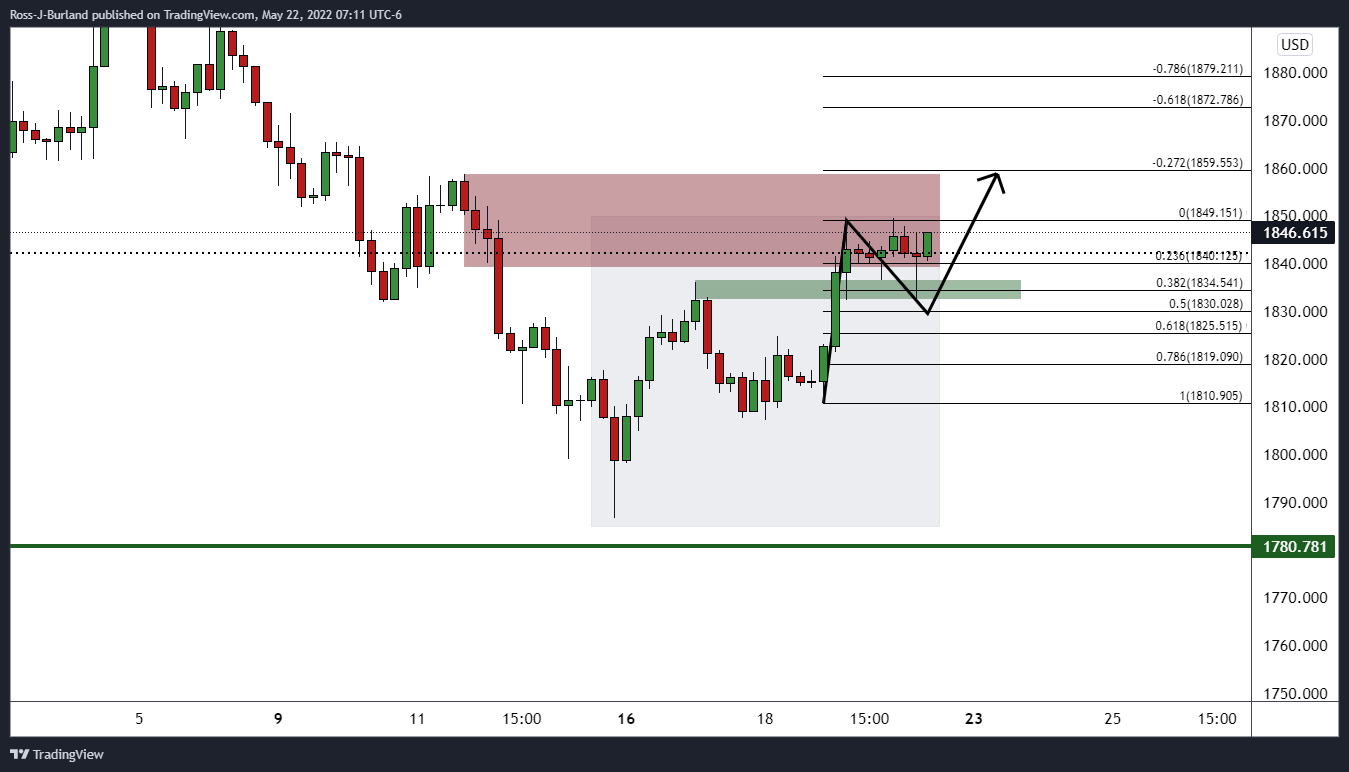
 The price has met resistance but the test of the 38.2% ratio has attracted the bulls. There are now prospects for a deeper correction of the weekly bearish impulse in order to mitigate the price imbalance on the four-hour chart towards $1,858. Thereafter, a 38.2% Fibo of the weekly impulse is located at 1,867:
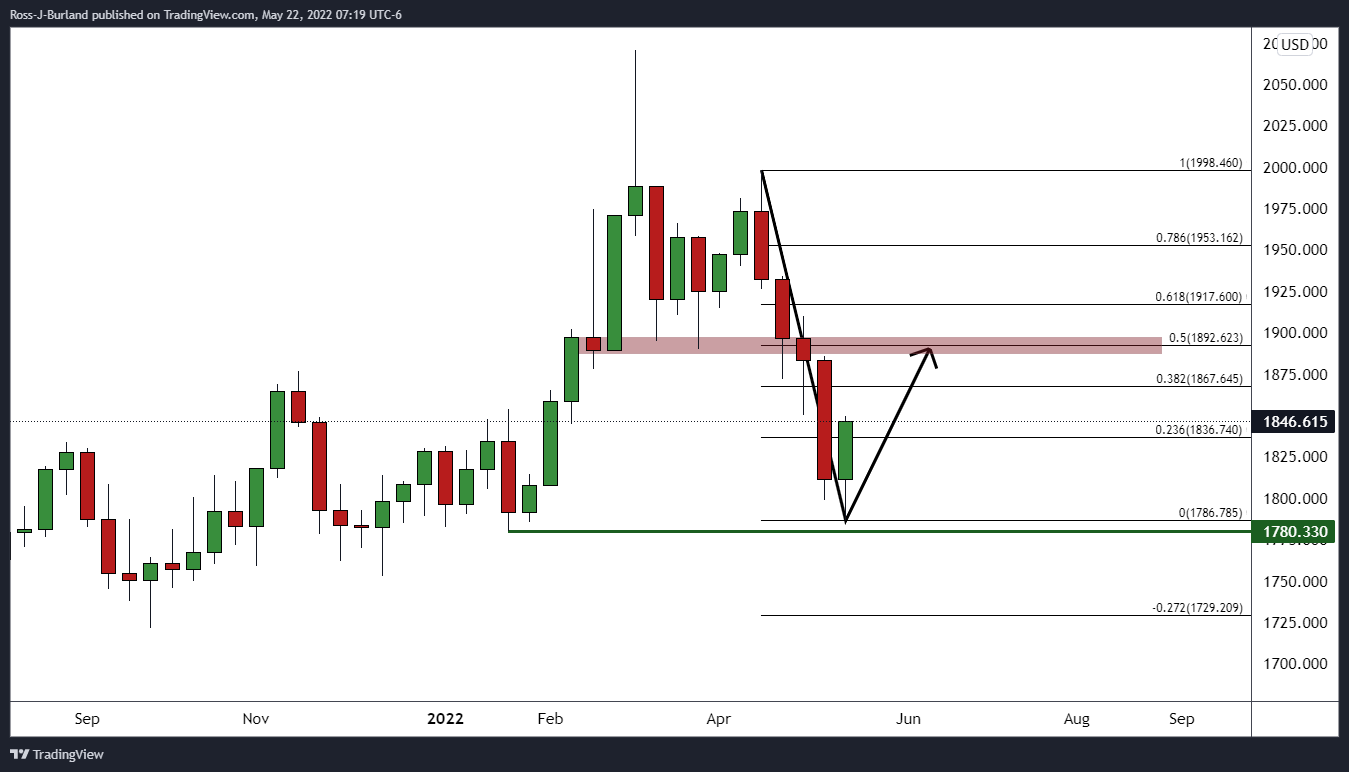
Gold weekly chart

If the bulls commit to the cause, then there will be prospects of a move higher in a 50% mean reversion:

Gold daily chart

For the meantime, the daily chart is compelling as well. 

The price has carved out a W-formation. This is a reversion pattern and the price would be expected to restest the neckline in due course. However, a break of the resistance near $1,860 will be needed to open the pathway toward the 50% mean reversion target on the weekly chart for the days ahead.  

Premium

You have reached your limit of 3 free articles for this month.

Start your subscription and get access to all our original articles.

Subscribe to PremiumSign In

Author

Ross J Burland

Ross J Burland, born in England, UK, is a sportsman at heart. He played Rugby and Judo for his county, Kent and the South East of England Rugby team.

More from Ross J Burland
Share:

Markets move fast. We move first.

Orange Juice Newsletter brings you expert driven insights - not headlines. Every day on your inbox.

By subscribing you agree to our Terms and conditions.

Editor's Picks

EUR/USD clings to small gains near 1.1750

Following a short-lasting correction in the early European session, EUR/USD regains its traction and clings to moderate gains at around 1.1750 on Monday. Nevertheless, the pair's volatility remains low, with investors awaiting this weeks key data releases from the US and the ECB policy announcements.

GBP/USD edges higher toward 1.3400 ahead of US data and BoE

GBP/USD reverses its direction and advances toward 1.3400 following a drop to the 1.3350 area earlier in the day. The US Dollar struggles to gather recovery momentum as markets await Tuesday's Nonfarm Payrolls data, while the Pound Sterling holds steady ahead of the BoE policy announcements later in the week.

Gold pulls away from session high, holds above $4,300

Gold loses its bullish momentum and retreats below $4,330 after testing $4,350 on Monday. XAU/USD, however, stays in positive territory as the US Dollar remains on the back foot on growing expectations for a dovish Fed policy outlook next year.

Solana consolidates as spot ETF inflows near $1 billion signal institutional dip-buying

Solana price hovers above $131 at the time of writing on Monday, nearing the upper boundary of a falling wedge pattern, awaiting a decisive breakout. On the institutional side, demand for spot Solana Exchange-Traded Funds remained firm, pushing total assets under management to nearly $1 billion since launch. 

Big week ends with big doubts

The S&P 500 continued to push higher yesterday as the US 2-year yield wavered around the 3.50% mark following a Federal Reserve (Fed) rate cut earlier this week that was ultimately perceived as not that hawkish after all. The cut is especially boosting the non-tech pockets of the market.

Solana Price Forecast: SOL consolidates as spot ETF inflows near $1 billion signal institutional dip-buying

Solana (SOL) price hovers above $131 at the time of writing on Monday, nearing the upper boundary of a falling wedge pattern, awaiting a decisive breakout.